Chinese vs Subsaharan African Family Poverty
COMPARE
Chinese
Subsaharan African
Family Poverty
Family Poverty Comparison
Chinese
Sub-Saharan Africans
6.5%
FAMILY POVERTY
100.0/ 100
METRIC RATING
2nd/ 347
METRIC RANK
10.9%
FAMILY POVERTY
0.2/ 100
METRIC RATING
258th/ 347
METRIC RANK
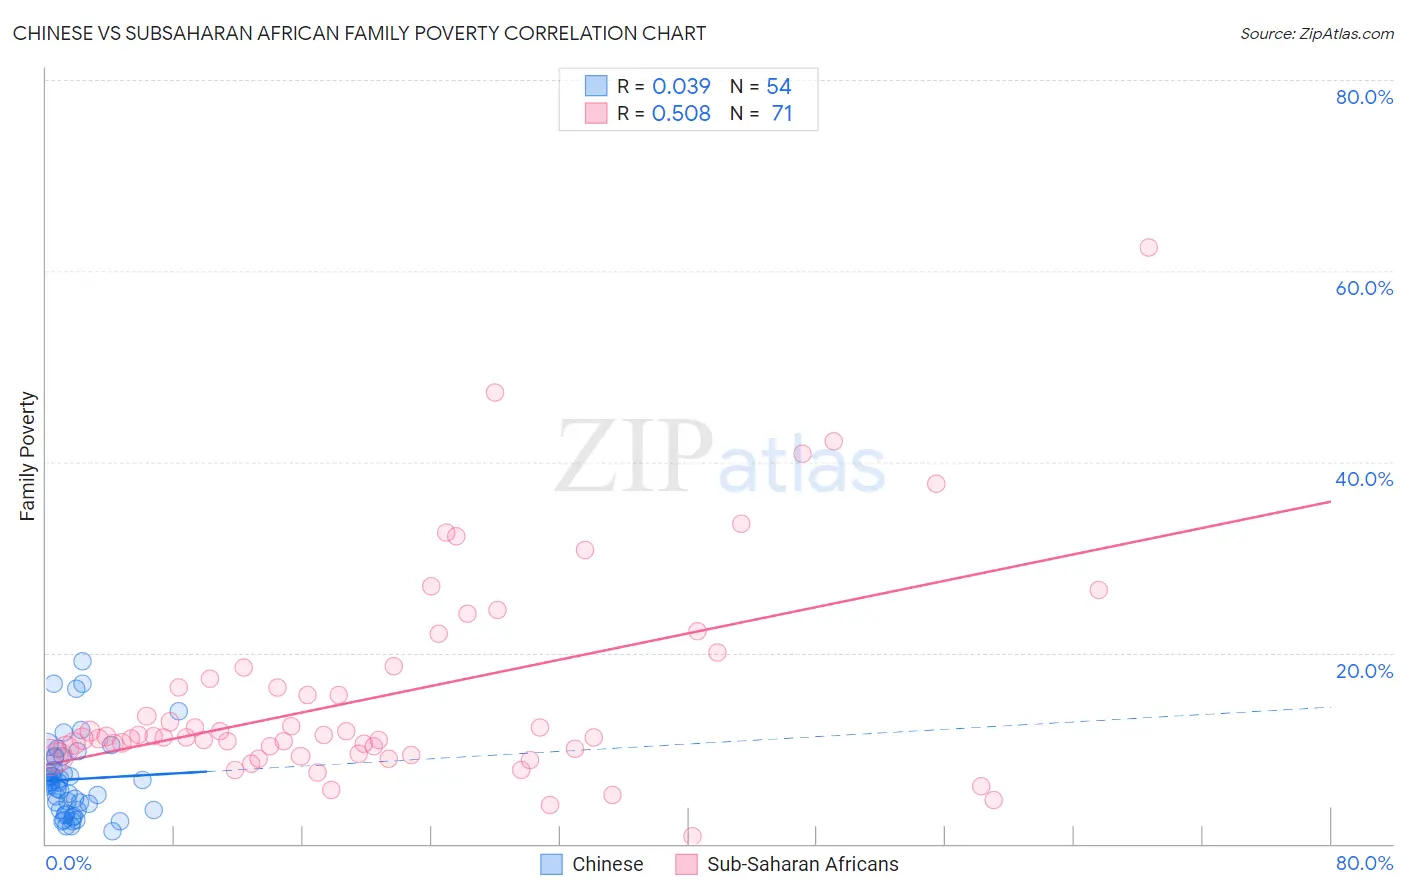
Chinese vs Subsaharan African Family Poverty Correlation Chart
The statistical analysis conducted on geographies consisting of 64,784,795 people shows no correlation between the proportion of Chinese and poverty level among families in the United States with a correlation coefficient (R) of 0.039 and weighted average of 6.5%. Similarly, the statistical analysis conducted on geographies consisting of 506,098,570 people shows a substantial positive correlation between the proportion of Sub-Saharan Africans and poverty level among families in the United States with a correlation coefficient (R) of 0.508 and weighted average of 10.9%, a difference of 66.8%.
Family Poverty Correlation Summary
| Measurement | Chinese | Subsaharan African |
| Minimum | 1.3% | 0.78% |
| Maximum | 19.1% | 62.5% |
| Range | 17.8% | 61.7% |
| Mean | 6.8% | 15.6% |
| Median | 6.3% | 11.1% |
| Interquartile 25% (IQ1) | 3.5% | 9.4% |
| Interquartile 75% (IQ3) | 9.0% | 18.4% |
| Interquartile Range (IQR) | 5.5% | 9.0% |
| Standard Deviation (Sample) | 4.1% | 11.1% |
| Standard Deviation (Population) | 4.1% | 11.0% |
Similar Demographics by Family Poverty
Demographics Similar to Chinese by Family Poverty
In terms of family poverty, the demographic groups most similar to Chinese are Immigrants from Taiwan (6.6%, a difference of 1.6%), Filipino (6.6%, a difference of 2.2%), Thai (6.7%, a difference of 2.8%), Immigrants from India (6.2%, a difference of 4.3%), and Norwegian (6.9%, a difference of 5.9%).
| Demographics | Rating | Rank | Family Poverty |
| Immigrants | India | 100.0 /100 | #1 | Exceptional 6.2% |
| Chinese | 100.0 /100 | #2 | Exceptional 6.5% |
| Immigrants | Taiwan | 100.0 /100 | #3 | Exceptional 6.6% |
| Filipinos | 100.0 /100 | #4 | Exceptional 6.6% |
| Thais | 100.0 /100 | #5 | Exceptional 6.7% |
| Norwegians | 99.9 /100 | #6 | Exceptional 6.9% |
| Immigrants | Ireland | 99.9 /100 | #7 | Exceptional 7.0% |
| Bhutanese | 99.9 /100 | #8 | Exceptional 7.0% |
| Latvians | 99.9 /100 | #9 | Exceptional 7.1% |
| Bulgarians | 99.8 /100 | #10 | Exceptional 7.1% |
| Immigrants | Singapore | 99.8 /100 | #11 | Exceptional 7.1% |
| Maltese | 99.8 /100 | #12 | Exceptional 7.1% |
| Swedes | 99.8 /100 | #13 | Exceptional 7.1% |
| Iranians | 99.8 /100 | #14 | Exceptional 7.1% |
| Lithuanians | 99.8 /100 | #15 | Exceptional 7.2% |
Demographics Similar to Sub-Saharan Africans by Family Poverty
In terms of family poverty, the demographic groups most similar to Sub-Saharan Africans are Immigrants from Ghana (10.8%, a difference of 0.030%), Mexican American Indian (10.9%, a difference of 0.040%), Chickasaw (10.8%, a difference of 0.070%), Immigrants from Liberia (10.8%, a difference of 0.34%), and Bangladeshi (10.9%, a difference of 0.39%).
| Demographics | Rating | Rank | Family Poverty |
| Iroquois | 0.3 /100 | #251 | Tragic 10.7% |
| Immigrants | Zaire | 0.3 /100 | #252 | Tragic 10.7% |
| Immigrants | Western Africa | 0.3 /100 | #253 | Tragic 10.7% |
| Ecuadorians | 0.2 /100 | #254 | Tragic 10.8% |
| Immigrants | Liberia | 0.2 /100 | #255 | Tragic 10.8% |
| Chickasaw | 0.2 /100 | #256 | Tragic 10.8% |
| Immigrants | Ghana | 0.2 /100 | #257 | Tragic 10.8% |
| Sub-Saharan Africans | 0.2 /100 | #258 | Tragic 10.9% |
| Mexican American Indians | 0.2 /100 | #259 | Tragic 10.9% |
| Bangladeshis | 0.2 /100 | #260 | Tragic 10.9% |
| Shoshone | 0.2 /100 | #261 | Tragic 10.9% |
| Spanish American Indians | 0.2 /100 | #262 | Tragic 10.9% |
| Cape Verdeans | 0.1 /100 | #263 | Tragic 10.9% |
| Trinidadians and Tobagonians | 0.1 /100 | #264 | Tragic 10.9% |
| Immigrants | Trinidad and Tobago | 0.1 /100 | #265 | Tragic 10.9% |