Chickasaw vs Black/African American Child Poverty Among Girls Under 16
COMPARE
Chickasaw
Black/African American
Child Poverty Among Girls Under 16
Child Poverty Among Girls Under 16 Comparison
Chickasaw
Blacks/African Americans
19.6%
CHILD POVERTY AMONG GIRLS UNDER 16
0.1/ 100
METRIC RATING
262nd/ 347
METRIC RANK
24.7%
CHILD POVERTY AMONG GIRLS UNDER 16
0.0/ 100
METRIC RATING
333rd/ 347
METRIC RANK
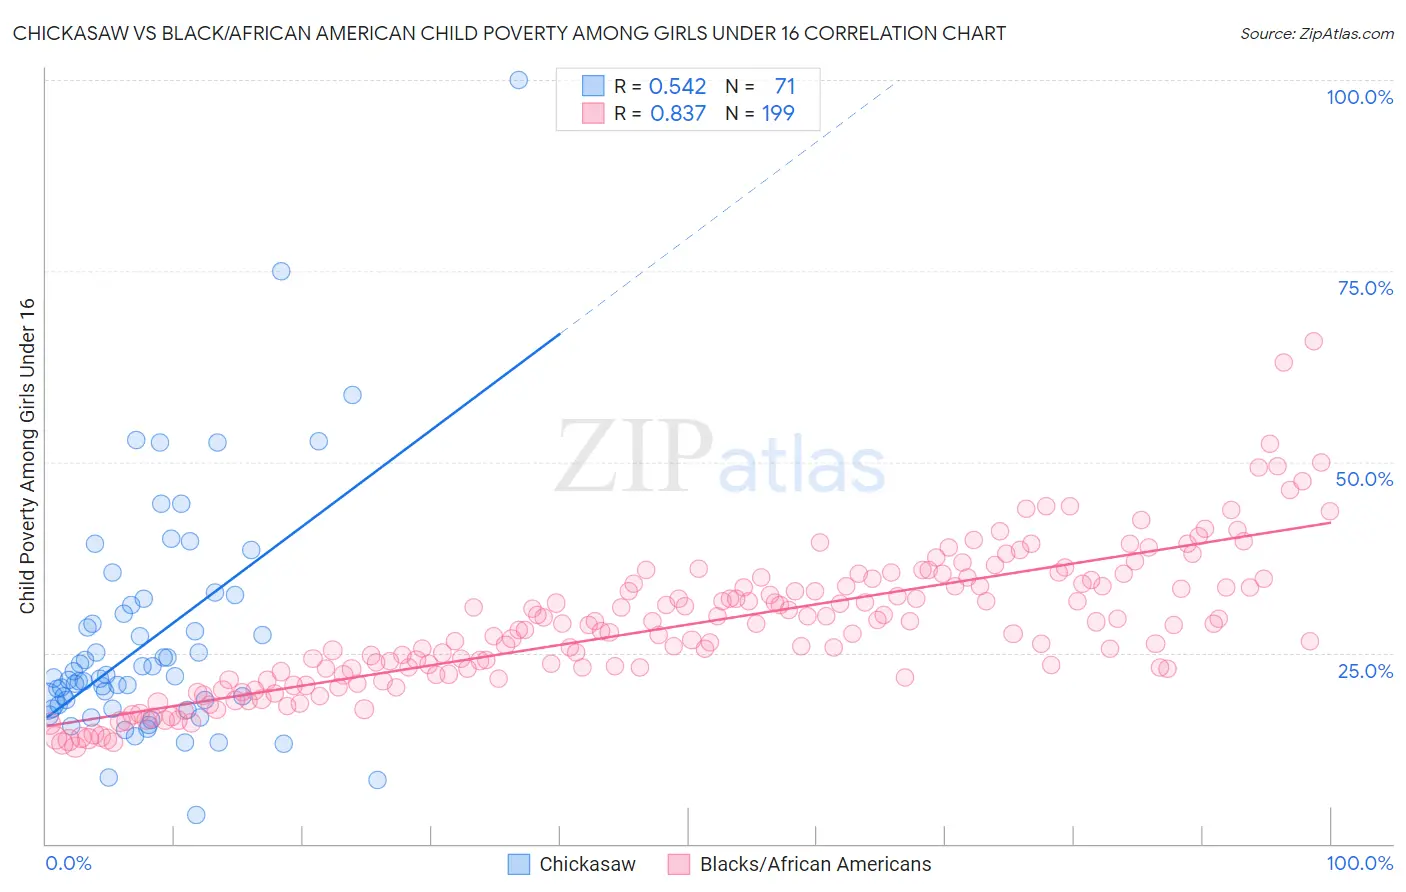
Chickasaw vs Black/African American Child Poverty Among Girls Under 16 Correlation Chart
The statistical analysis conducted on geographies consisting of 146,952,830 people shows a substantial positive correlation between the proportion of Chickasaw and poverty level among girls under the age of 16 in the United States with a correlation coefficient (R) of 0.542 and weighted average of 19.6%. Similarly, the statistical analysis conducted on geographies consisting of 546,554,396 people shows a very strong positive correlation between the proportion of Blacks/African Americans and poverty level among girls under the age of 16 in the United States with a correlation coefficient (R) of 0.837 and weighted average of 24.7%, a difference of 25.6%.
Child Poverty Among Girls Under 16 Correlation Summary
| Measurement | Chickasaw | Black/African American |
| Minimum | 3.8% | 12.6% |
| Maximum | 100.0% | 65.8% |
| Range | 96.2% | 53.1% |
| Mean | 26.8% | 28.6% |
| Median | 21.7% | 28.6% |
| Interquartile 25% (IQ1) | 17.6% | 22.1% |
| Interquartile 75% (IQ3) | 31.3% | 34.0% |
| Interquartile Range (IQR) | 13.6% | 11.9% |
| Standard Deviation (Sample) | 15.5% | 9.2% |
| Standard Deviation (Population) | 15.4% | 9.2% |
Similar Demographics by Child Poverty Among Girls Under 16
Demographics Similar to Chickasaw by Child Poverty Among Girls Under 16
In terms of child poverty among girls under 16, the demographic groups most similar to Chickasaw are Immigrants from Burma/Myanmar (19.7%, a difference of 0.12%), Jamaican (19.7%, a difference of 0.23%), Vietnamese (19.5%, a difference of 0.52%), Mexican American Indian (19.5%, a difference of 0.61%), and Immigrants from Jamaica (19.8%, a difference of 0.67%).
| Demographics | Rating | Rank | Child Poverty Among Girls Under 16 |
| Immigrants | Ecuador | 0.3 /100 | #255 | Tragic 19.3% |
| Trinidadians and Tobagonians | 0.2 /100 | #256 | Tragic 19.3% |
| Guyanese | 0.2 /100 | #257 | Tragic 19.4% |
| Salvadorans | 0.2 /100 | #258 | Tragic 19.4% |
| Ottawa | 0.2 /100 | #259 | Tragic 19.4% |
| Mexican American Indians | 0.2 /100 | #260 | Tragic 19.5% |
| Vietnamese | 0.2 /100 | #261 | Tragic 19.5% |
| Chickasaw | 0.1 /100 | #262 | Tragic 19.6% |
| Immigrants | Burma/Myanmar | 0.1 /100 | #263 | Tragic 19.7% |
| Jamaicans | 0.1 /100 | #264 | Tragic 19.7% |
| Immigrants | Jamaica | 0.1 /100 | #265 | Tragic 19.8% |
| Spanish Americans | 0.1 /100 | #266 | Tragic 19.8% |
| Immigrants | Bangladesh | 0.1 /100 | #267 | Tragic 19.9% |
| Spanish American Indians | 0.1 /100 | #268 | Tragic 19.9% |
| Liberians | 0.1 /100 | #269 | Tragic 19.9% |
Demographics Similar to Blacks/African Americans by Child Poverty Among Girls Under 16
In terms of child poverty among girls under 16, the demographic groups most similar to Blacks/African Americans are Menominee (25.0%, a difference of 1.5%), Pueblo (25.2%, a difference of 2.2%), Native/Alaskan (24.0%, a difference of 2.5%), Apache (23.8%, a difference of 3.4%), and Immigrants from Dominican Republic (23.8%, a difference of 3.5%).
| Demographics | Rating | Rank | Child Poverty Among Girls Under 16 |
| Immigrants | Honduras | 0.0 /100 | #326 | Tragic 22.8% |
| Central American Indians | 0.0 /100 | #327 | Tragic 22.8% |
| Dominicans | 0.0 /100 | #328 | Tragic 23.7% |
| Kiowa | 0.0 /100 | #329 | Tragic 23.7% |
| Immigrants | Dominican Republic | 0.0 /100 | #330 | Tragic 23.8% |
| Apache | 0.0 /100 | #331 | Tragic 23.8% |
| Natives/Alaskans | 0.0 /100 | #332 | Tragic 24.0% |
| Blacks/African Americans | 0.0 /100 | #333 | Tragic 24.7% |
| Menominee | 0.0 /100 | #334 | Tragic 25.0% |
| Pueblo | 0.0 /100 | #335 | Tragic 25.2% |
| Sioux | 0.0 /100 | #336 | Tragic 25.6% |
| Yup'ik | 0.0 /100 | #337 | Tragic 25.8% |
| Cheyenne | 0.0 /100 | #338 | Tragic 26.3% |
| Crow | 0.0 /100 | #339 | Tragic 26.4% |
| Yuman | 0.0 /100 | #340 | Tragic 27.1% |