Pueblo vs Black/African American Child Poverty Among Girls Under 16
COMPARE
Pueblo
Black/African American
Child Poverty Among Girls Under 16
Child Poverty Among Girls Under 16 Comparison
Pueblo
Blacks/African Americans
25.2%
CHILD POVERTY AMONG GIRLS UNDER 16
0.0/ 100
METRIC RATING
335th/ 347
METRIC RANK
24.7%
CHILD POVERTY AMONG GIRLS UNDER 16
0.0/ 100
METRIC RATING
333rd/ 347
METRIC RANK
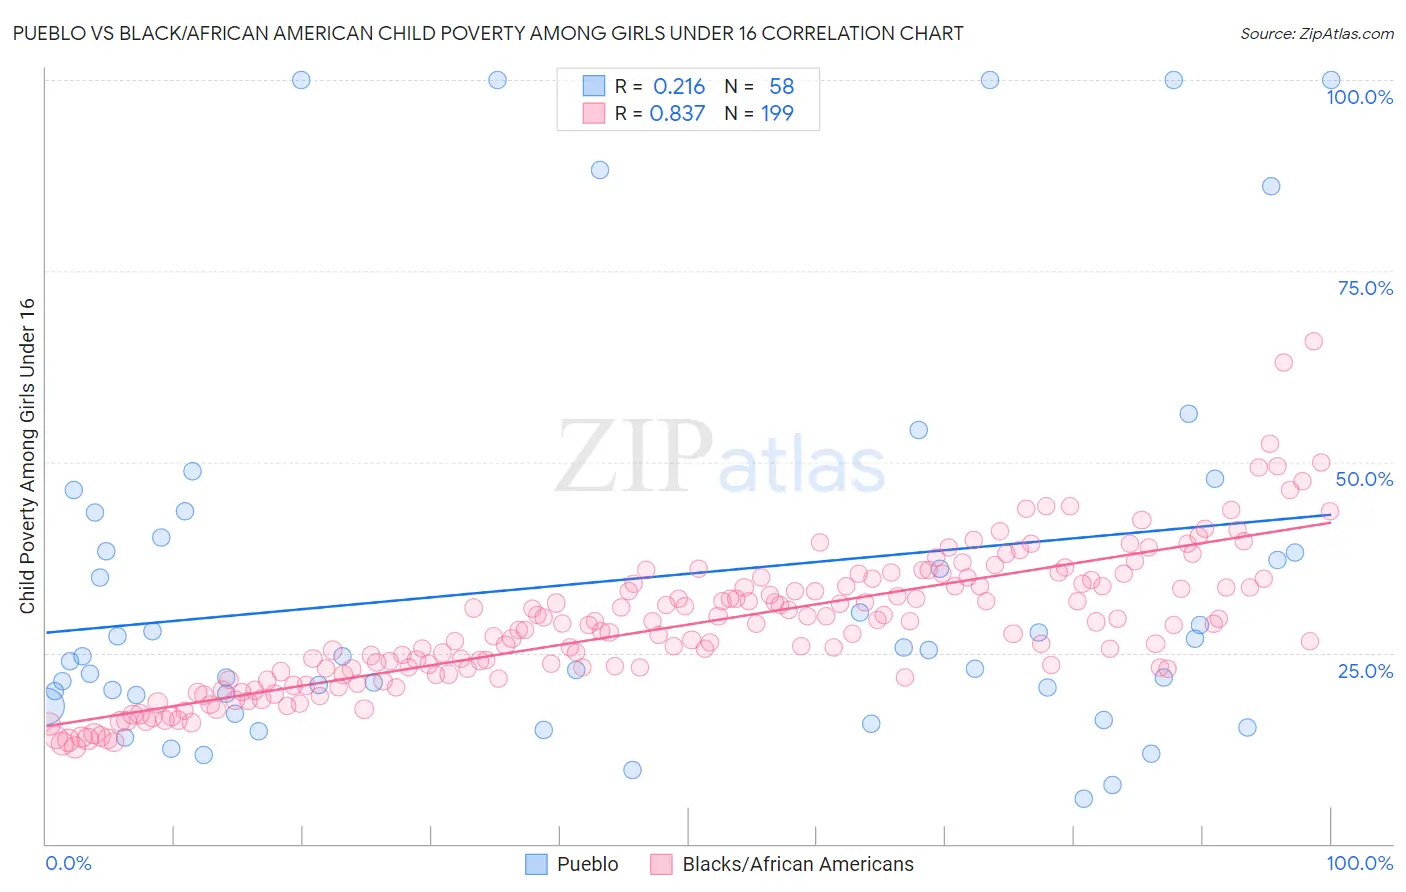
Pueblo vs Black/African American Child Poverty Among Girls Under 16 Correlation Chart
The statistical analysis conducted on geographies consisting of 119,548,196 people shows a weak positive correlation between the proportion of Pueblo and poverty level among girls under the age of 16 in the United States with a correlation coefficient (R) of 0.216 and weighted average of 25.2%. Similarly, the statistical analysis conducted on geographies consisting of 546,554,396 people shows a very strong positive correlation between the proportion of Blacks/African Americans and poverty level among girls under the age of 16 in the United States with a correlation coefficient (R) of 0.837 and weighted average of 24.7%, a difference of 2.2%.
Child Poverty Among Girls Under 16 Correlation Summary
| Measurement | Pueblo | Black/African American |
| Minimum | 5.9% | 12.6% |
| Maximum | 100.0% | 65.8% |
| Range | 94.1% | 53.1% |
| Mean | 34.3% | 28.6% |
| Median | 24.5% | 28.6% |
| Interquartile 25% (IQ1) | 19.5% | 22.1% |
| Interquartile 75% (IQ3) | 40.1% | 34.0% |
| Interquartile Range (IQR) | 20.5% | 11.9% |
| Standard Deviation (Sample) | 25.9% | 9.2% |
| Standard Deviation (Population) | 25.7% | 9.2% |
Demographics Similar to Pueblo and Blacks/African Americans by Child Poverty Among Girls Under 16
In terms of child poverty among girls under 16, the demographic groups most similar to Pueblo are Menominee (25.0%, a difference of 0.70%), Sioux (25.6%, a difference of 1.5%), Yup'ik (25.8%, a difference of 2.4%), Cheyenne (26.3%, a difference of 4.3%), and Crow (26.4%, a difference of 4.6%). Similarly, the demographic groups most similar to Blacks/African Americans are Menominee (25.0%, a difference of 1.5%), Native/Alaskan (24.0%, a difference of 2.5%), Apache (23.8%, a difference of 3.4%), Immigrants from Dominican Republic (23.8%, a difference of 3.5%), and Sioux (25.6%, a difference of 3.7%).
| Demographics | Rating | Rank | Child Poverty Among Girls Under 16 |
| Paiute | 0.0 /100 | #324 | Tragic 22.6% |
| Immigrants | Congo | 0.0 /100 | #325 | Tragic 22.7% |
| Immigrants | Honduras | 0.0 /100 | #326 | Tragic 22.8% |
| Central American Indians | 0.0 /100 | #327 | Tragic 22.8% |
| Dominicans | 0.0 /100 | #328 | Tragic 23.7% |
| Kiowa | 0.0 /100 | #329 | Tragic 23.7% |
| Immigrants | Dominican Republic | 0.0 /100 | #330 | Tragic 23.8% |
| Apache | 0.0 /100 | #331 | Tragic 23.8% |
| Natives/Alaskans | 0.0 /100 | #332 | Tragic 24.0% |
| Blacks/African Americans | 0.0 /100 | #333 | Tragic 24.7% |
| Menominee | 0.0 /100 | #334 | Tragic 25.0% |
| Pueblo | 0.0 /100 | #335 | Tragic 25.2% |
| Sioux | 0.0 /100 | #336 | Tragic 25.6% |
| Yup'ik | 0.0 /100 | #337 | Tragic 25.8% |
| Cheyenne | 0.0 /100 | #338 | Tragic 26.3% |
| Crow | 0.0 /100 | #339 | Tragic 26.4% |
| Yuman | 0.0 /100 | #340 | Tragic 27.1% |
| Hopi | 0.0 /100 | #341 | Tragic 27.9% |
| Pima | 0.0 /100 | #342 | Tragic 28.2% |
| Immigrants | Yemen | 0.0 /100 | #343 | Tragic 29.5% |
| Navajo | 0.0 /100 | #344 | Tragic 30.5% |