Chickasaw vs Immigrants from Italy Child Poverty Among Girls Under 16
COMPARE
Chickasaw
Immigrants from Italy
Child Poverty Among Girls Under 16
Child Poverty Among Girls Under 16 Comparison
Chickasaw
Immigrants from Italy
19.6%
CHILD POVERTY AMONG GIRLS UNDER 16
0.1/ 100
METRIC RATING
262nd/ 347
METRIC RANK
14.8%
CHILD POVERTY AMONG GIRLS UNDER 16
97.4/ 100
METRIC RATING
83rd/ 347
METRIC RANK
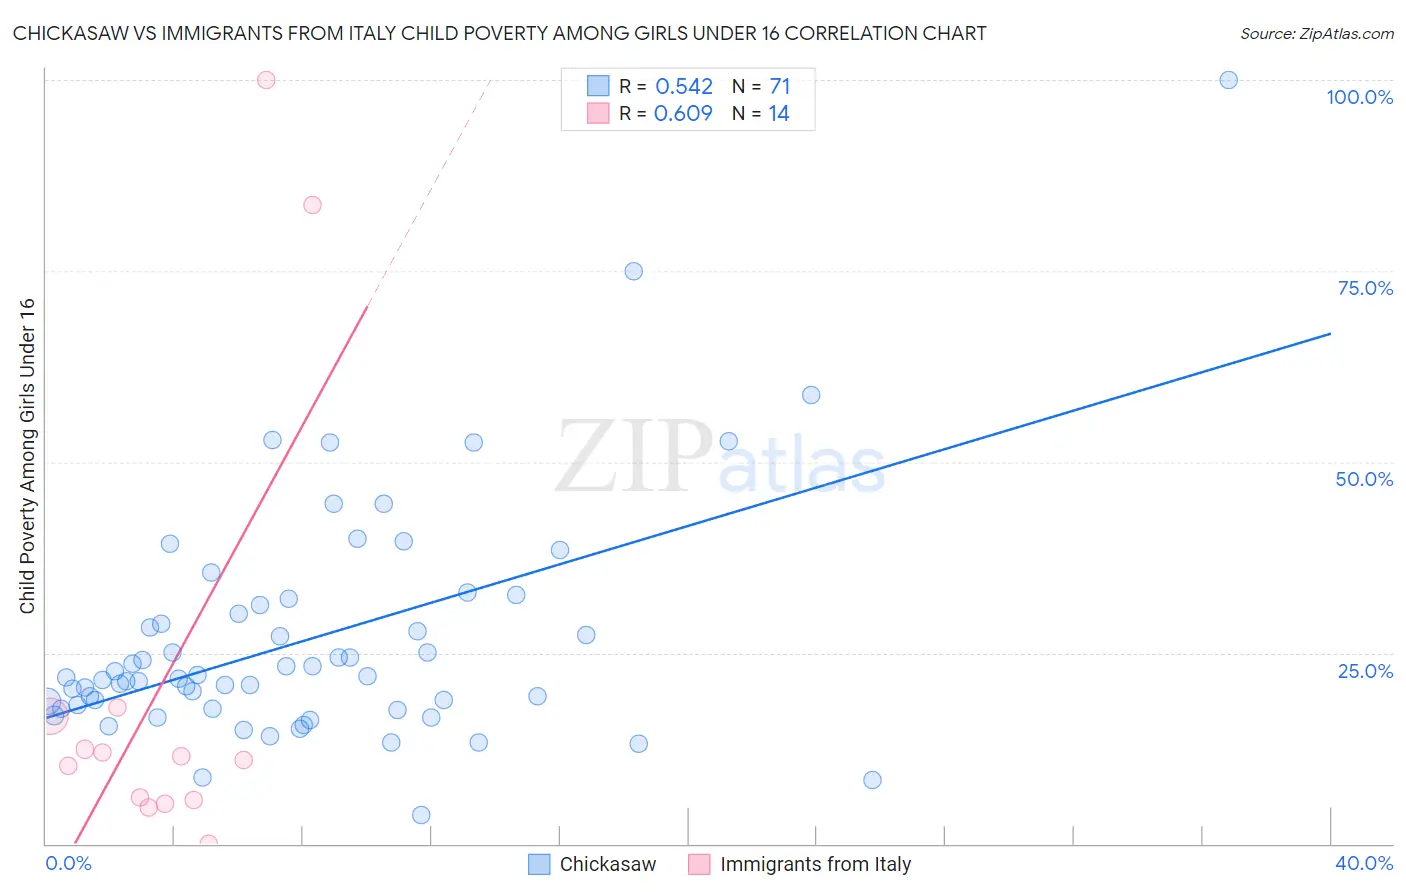
Chickasaw vs Immigrants from Italy Child Poverty Among Girls Under 16 Correlation Chart
The statistical analysis conducted on geographies consisting of 146,952,830 people shows a substantial positive correlation between the proportion of Chickasaw and poverty level among girls under the age of 16 in the United States with a correlation coefficient (R) of 0.542 and weighted average of 19.6%. Similarly, the statistical analysis conducted on geographies consisting of 317,038,083 people shows a significant positive correlation between the proportion of Immigrants from Italy and poverty level among girls under the age of 16 in the United States with a correlation coefficient (R) of 0.609 and weighted average of 14.8%, a difference of 33.0%.
Child Poverty Among Girls Under 16 Correlation Summary
| Measurement | Chickasaw | Immigrants from Italy |
| Minimum | 3.8% | 0.033% |
| Maximum | 100.0% | 100.0% |
| Range | 96.2% | 100.0% |
| Mean | 26.8% | 21.2% |
| Median | 21.7% | 11.2% |
| Interquartile 25% (IQ1) | 17.6% | 5.7% |
| Interquartile 75% (IQ3) | 31.3% | 16.7% |
| Interquartile Range (IQR) | 13.6% | 11.0% |
| Standard Deviation (Sample) | 15.5% | 30.5% |
| Standard Deviation (Population) | 15.4% | 29.3% |
Similar Demographics by Child Poverty Among Girls Under 16
Demographics Similar to Chickasaw by Child Poverty Among Girls Under 16
In terms of child poverty among girls under 16, the demographic groups most similar to Chickasaw are Immigrants from Burma/Myanmar (19.7%, a difference of 0.12%), Jamaican (19.7%, a difference of 0.23%), Vietnamese (19.5%, a difference of 0.52%), Mexican American Indian (19.5%, a difference of 0.61%), and Immigrants from Jamaica (19.8%, a difference of 0.67%).
| Demographics | Rating | Rank | Child Poverty Among Girls Under 16 |
| Immigrants | Ecuador | 0.3 /100 | #255 | Tragic 19.3% |
| Trinidadians and Tobagonians | 0.2 /100 | #256 | Tragic 19.3% |
| Guyanese | 0.2 /100 | #257 | Tragic 19.4% |
| Salvadorans | 0.2 /100 | #258 | Tragic 19.4% |
| Ottawa | 0.2 /100 | #259 | Tragic 19.4% |
| Mexican American Indians | 0.2 /100 | #260 | Tragic 19.5% |
| Vietnamese | 0.2 /100 | #261 | Tragic 19.5% |
| Chickasaw | 0.1 /100 | #262 | Tragic 19.6% |
| Immigrants | Burma/Myanmar | 0.1 /100 | #263 | Tragic 19.7% |
| Jamaicans | 0.1 /100 | #264 | Tragic 19.7% |
| Immigrants | Jamaica | 0.1 /100 | #265 | Tragic 19.8% |
| Spanish Americans | 0.1 /100 | #266 | Tragic 19.8% |
| Immigrants | Bangladesh | 0.1 /100 | #267 | Tragic 19.9% |
| Spanish American Indians | 0.1 /100 | #268 | Tragic 19.9% |
| Liberians | 0.1 /100 | #269 | Tragic 19.9% |
Demographics Similar to Immigrants from Italy by Child Poverty Among Girls Under 16
In terms of child poverty among girls under 16, the demographic groups most similar to Immigrants from Italy are Soviet Union (14.8%, a difference of 0.070%), Swiss (14.8%, a difference of 0.19%), Australian (14.8%, a difference of 0.23%), Macedonian (14.7%, a difference of 0.25%), and Finnish (14.8%, a difference of 0.25%).
| Demographics | Rating | Rank | Child Poverty Among Girls Under 16 |
| Immigrants | Russia | 97.9 /100 | #76 | Exceptional 14.7% |
| Tlingit-Haida | 97.9 /100 | #77 | Exceptional 14.7% |
| Argentineans | 97.9 /100 | #78 | Exceptional 14.7% |
| Immigrants | Turkey | 97.9 /100 | #79 | Exceptional 14.7% |
| Egyptians | 97.9 /100 | #80 | Exceptional 14.7% |
| Ukrainians | 97.7 /100 | #81 | Exceptional 14.7% |
| Macedonians | 97.6 /100 | #82 | Exceptional 14.7% |
| Immigrants | Italy | 97.4 /100 | #83 | Exceptional 14.8% |
| Soviet Union | 97.3 /100 | #84 | Exceptional 14.8% |
| Swiss | 97.2 /100 | #85 | Exceptional 14.8% |
| Australians | 97.2 /100 | #86 | Exceptional 14.8% |
| Finns | 97.2 /100 | #87 | Exceptional 14.8% |
| Immigrants | Canada | 97.1 /100 | #88 | Exceptional 14.8% |
| Jordanians | 97.1 /100 | #89 | Exceptional 14.8% |
| Northern Europeans | 97.0 /100 | #90 | Exceptional 14.8% |