Immigrants from Lebanon vs Black/African American Child Poverty Among Girls Under 16
COMPARE
Immigrants from Lebanon
Black/African American
Child Poverty Among Girls Under 16
Child Poverty Among Girls Under 16 Comparison
Immigrants from Lebanon
Blacks/African Americans
17.1%
CHILD POVERTY AMONG GIRLS UNDER 16
22.6/ 100
METRIC RATING
198th/ 347
METRIC RANK
24.7%
CHILD POVERTY AMONG GIRLS UNDER 16
0.0/ 100
METRIC RATING
333rd/ 347
METRIC RANK
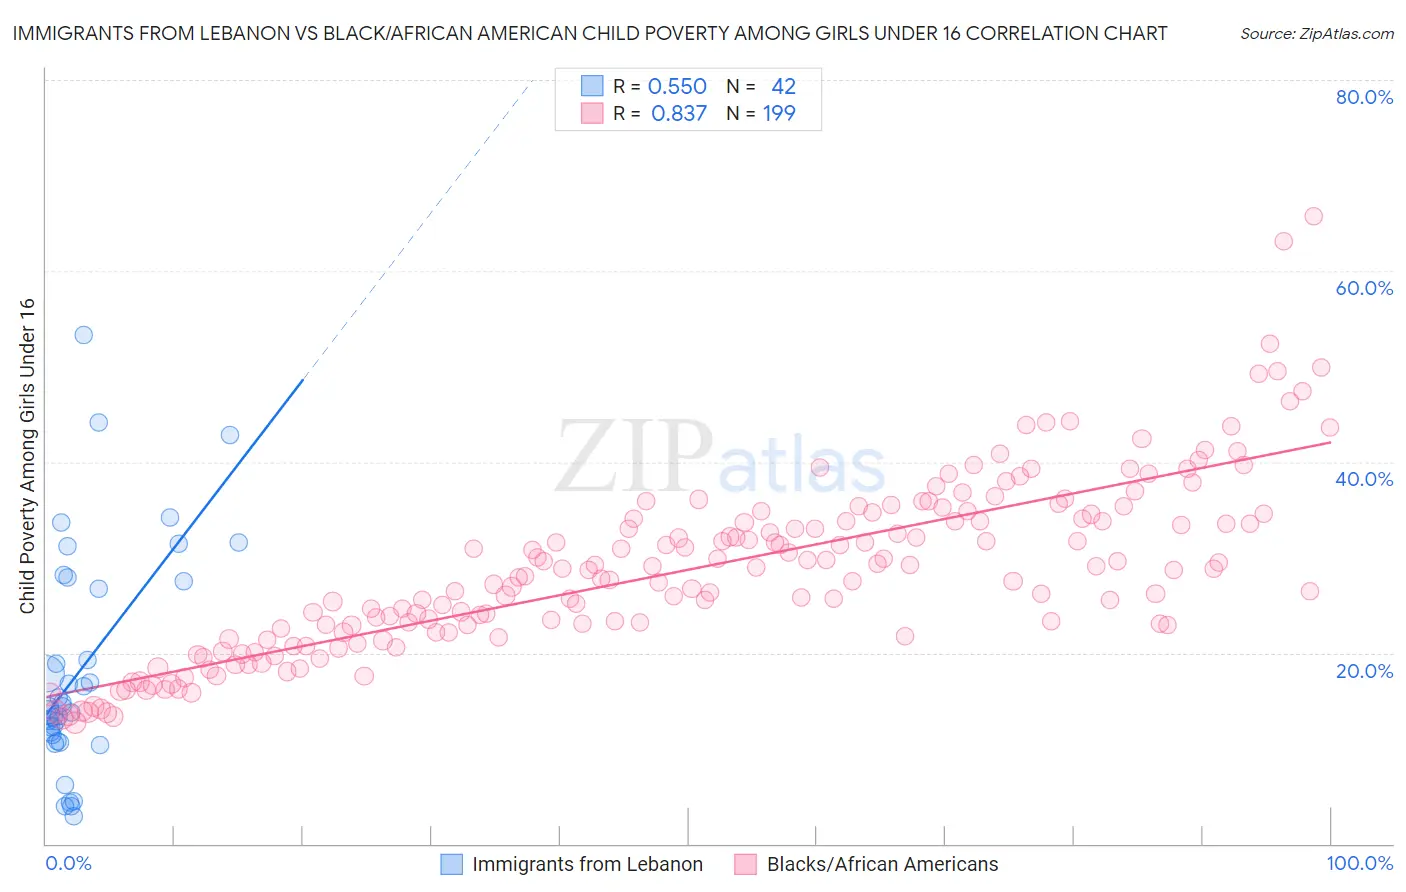
Immigrants from Lebanon vs Black/African American Child Poverty Among Girls Under 16 Correlation Chart
The statistical analysis conducted on geographies consisting of 214,720,358 people shows a substantial positive correlation between the proportion of Immigrants from Lebanon and poverty level among girls under the age of 16 in the United States with a correlation coefficient (R) of 0.550 and weighted average of 17.1%. Similarly, the statistical analysis conducted on geographies consisting of 546,554,396 people shows a very strong positive correlation between the proportion of Blacks/African Americans and poverty level among girls under the age of 16 in the United States with a correlation coefficient (R) of 0.837 and weighted average of 24.7%, a difference of 44.6%.
Child Poverty Among Girls Under 16 Correlation Summary
| Measurement | Immigrants from Lebanon | Black/African American |
| Minimum | 2.9% | 12.6% |
| Maximum | 53.3% | 65.8% |
| Range | 50.5% | 53.1% |
| Mean | 18.4% | 28.6% |
| Median | 14.3% | 28.6% |
| Interquartile 25% (IQ1) | 11.4% | 22.1% |
| Interquartile 75% (IQ3) | 27.5% | 34.0% |
| Interquartile Range (IQR) | 16.1% | 11.9% |
| Standard Deviation (Sample) | 11.7% | 9.2% |
| Standard Deviation (Population) | 11.6% | 9.2% |
Similar Demographics by Child Poverty Among Girls Under 16
Demographics Similar to Immigrants from Lebanon by Child Poverty Among Girls Under 16
In terms of child poverty among girls under 16, the demographic groups most similar to Immigrants from Lebanon are Immigrants from Afghanistan (17.1%, a difference of 0.020%), Immigrants from Uzbekistan (17.1%, a difference of 0.18%), Spaniard (17.0%, a difference of 0.35%), Celtic (17.0%, a difference of 0.41%), and Immigrants from Costa Rica (17.0%, a difference of 0.46%).
| Demographics | Rating | Rank | Child Poverty Among Girls Under 16 |
| Immigrants | Azores | 31.3 /100 | #191 | Fair 16.8% |
| Immigrants | Uganda | 31.3 /100 | #192 | Fair 16.8% |
| Aleuts | 28.7 /100 | #193 | Fair 16.9% |
| Spanish | 28.6 /100 | #194 | Fair 16.9% |
| Immigrants | Costa Rica | 25.6 /100 | #195 | Fair 17.0% |
| Celtics | 25.2 /100 | #196 | Fair 17.0% |
| Spaniards | 24.9 /100 | #197 | Fair 17.0% |
| Immigrants | Lebanon | 22.6 /100 | #198 | Fair 17.1% |
| Immigrants | Afghanistan | 22.4 /100 | #199 | Fair 17.1% |
| Immigrants | Uzbekistan | 21.5 /100 | #200 | Fair 17.1% |
| Immigrants | Kenya | 17.8 /100 | #201 | Poor 17.2% |
| Immigrants | Sierra Leone | 17.6 /100 | #202 | Poor 17.2% |
| Ugandans | 17.5 /100 | #203 | Poor 17.2% |
| Iraqis | 13.0 /100 | #204 | Poor 17.4% |
| Immigrants | Cameroon | 12.6 /100 | #205 | Poor 17.4% |
Demographics Similar to Blacks/African Americans by Child Poverty Among Girls Under 16
In terms of child poverty among girls under 16, the demographic groups most similar to Blacks/African Americans are Menominee (25.0%, a difference of 1.5%), Pueblo (25.2%, a difference of 2.2%), Native/Alaskan (24.0%, a difference of 2.5%), Apache (23.8%, a difference of 3.4%), and Immigrants from Dominican Republic (23.8%, a difference of 3.5%).
| Demographics | Rating | Rank | Child Poverty Among Girls Under 16 |
| Immigrants | Honduras | 0.0 /100 | #326 | Tragic 22.8% |
| Central American Indians | 0.0 /100 | #327 | Tragic 22.8% |
| Dominicans | 0.0 /100 | #328 | Tragic 23.7% |
| Kiowa | 0.0 /100 | #329 | Tragic 23.7% |
| Immigrants | Dominican Republic | 0.0 /100 | #330 | Tragic 23.8% |
| Apache | 0.0 /100 | #331 | Tragic 23.8% |
| Natives/Alaskans | 0.0 /100 | #332 | Tragic 24.0% |
| Blacks/African Americans | 0.0 /100 | #333 | Tragic 24.7% |
| Menominee | 0.0 /100 | #334 | Tragic 25.0% |
| Pueblo | 0.0 /100 | #335 | Tragic 25.2% |
| Sioux | 0.0 /100 | #336 | Tragic 25.6% |
| Yup'ik | 0.0 /100 | #337 | Tragic 25.8% |
| Cheyenne | 0.0 /100 | #338 | Tragic 26.3% |
| Crow | 0.0 /100 | #339 | Tragic 26.4% |
| Yuman | 0.0 /100 | #340 | Tragic 27.1% |