Kenyan vs Iraqi Female Poverty
COMPARE
Kenyan
Iraqi
Female Poverty
Female Poverty Comparison
Kenyans
Iraqis
13.5%
FEMALE POVERTY
43.8/ 100
METRIC RATING
183rd/ 347
METRIC RANK
13.7%
FEMALE POVERTY
31.8/ 100
METRIC RATING
193rd/ 347
METRIC RANK
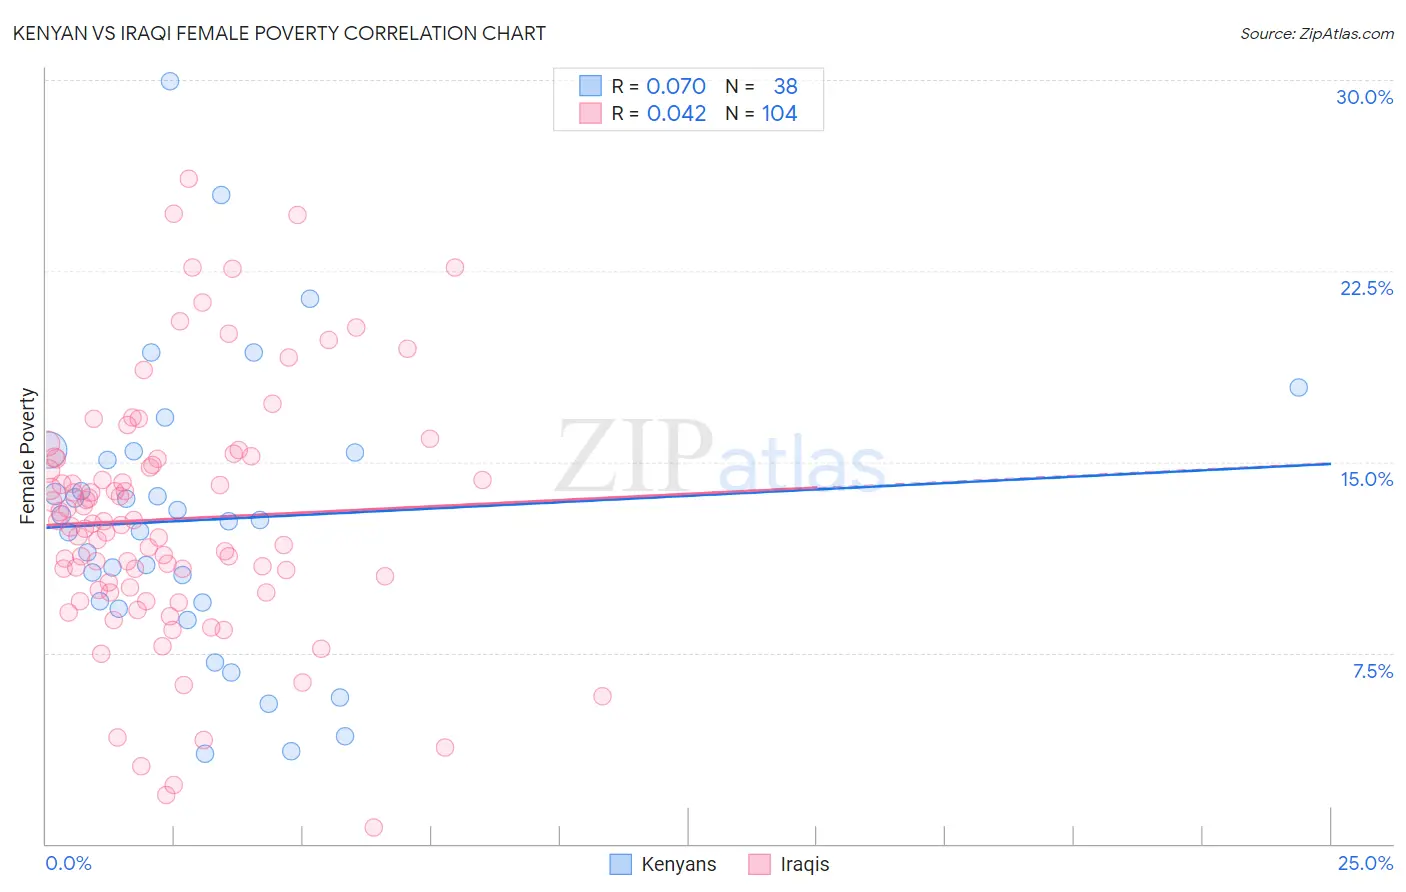
Kenyan vs Iraqi Female Poverty Correlation Chart
The statistical analysis conducted on geographies consisting of 168,133,672 people shows a slight positive correlation between the proportion of Kenyans and poverty level among females in the United States with a correlation coefficient (R) of 0.070 and weighted average of 13.5%. Similarly, the statistical analysis conducted on geographies consisting of 170,556,869 people shows no correlation between the proportion of Iraqis and poverty level among females in the United States with a correlation coefficient (R) of 0.042 and weighted average of 13.7%, a difference of 1.2%.
Female Poverty Correlation Summary
| Measurement | Kenyan | Iraqi |
| Minimum | 3.5% | 0.62% |
| Maximum | 29.9% | 26.1% |
| Range | 26.4% | 25.5% |
| Mean | 12.7% | 12.8% |
| Median | 12.7% | 12.5% |
| Interquartile 25% (IQ1) | 9.5% | 10.0% |
| Interquartile 75% (IQ3) | 15.4% | 15.1% |
| Interquartile Range (IQR) | 5.9% | 5.1% |
| Standard Deviation (Sample) | 5.6% | 4.9% |
| Standard Deviation (Population) | 5.5% | 4.9% |
Demographics Similar to Kenyans and Iraqis by Female Poverty
In terms of female poverty, the demographic groups most similar to Kenyans are Immigrants from Sierra Leone (13.5%, a difference of 0.060%), Venezuelan (13.5%, a difference of 0.070%), Immigrants from Colombia (13.5%, a difference of 0.070%), South American (13.5%, a difference of 0.10%), and Immigrants from Cameroon (13.5%, a difference of 0.17%). Similarly, the demographic groups most similar to Iraqis are Immigrants from Costa Rica (13.7%, a difference of 0.020%), Delaware (13.7%, a difference of 0.070%), Immigrants from Kuwait (13.7%, a difference of 0.10%), Immigrants from South America (13.7%, a difference of 0.12%), and Sierra Leonean (13.7%, a difference of 0.14%).
| Demographics | Rating | Rank | Female Poverty |
| Israelis | 49.1 /100 | #178 | Average 13.5% |
| Immigrants | Syria | 48.8 /100 | #179 | Average 13.5% |
| South Americans | 44.8 /100 | #180 | Average 13.5% |
| Venezuelans | 44.5 /100 | #181 | Average 13.5% |
| Immigrants | Colombia | 44.5 /100 | #182 | Average 13.5% |
| Kenyans | 43.8 /100 | #183 | Average 13.5% |
| Immigrants | Sierra Leone | 43.2 /100 | #184 | Average 13.5% |
| Immigrants | Cameroon | 42.0 /100 | #185 | Average 13.5% |
| Immigrants | Portugal | 41.5 /100 | #186 | Average 13.6% |
| Immigrants | Venezuela | 41.0 /100 | #187 | Average 13.6% |
| Hawaiians | 39.9 /100 | #188 | Fair 13.6% |
| Uruguayans | 39.8 /100 | #189 | Fair 13.6% |
| Sierra Leoneans | 33.1 /100 | #190 | Fair 13.7% |
| Immigrants | Kuwait | 32.7 /100 | #191 | Fair 13.7% |
| Immigrants | Costa Rica | 31.9 /100 | #192 | Fair 13.7% |
| Iraqis | 31.8 /100 | #193 | Fair 13.7% |
| Delaware | 31.1 /100 | #194 | Fair 13.7% |
| Immigrants | South America | 30.6 /100 | #195 | Fair 13.7% |
| South American Indians | 28.9 /100 | #196 | Fair 13.7% |
| Arabs | 28.6 /100 | #197 | Fair 13.7% |
| Immigrants | Uganda | 28.5 /100 | #198 | Fair 13.7% |