Laotian vs Iraqi Female Poverty
COMPARE
Laotian
Iraqi
Female Poverty
Female Poverty Comparison
Laotians
Iraqis
12.6%
FEMALE POVERTY
93.4/ 100
METRIC RATING
107th/ 347
METRIC RANK
13.7%
FEMALE POVERTY
31.8/ 100
METRIC RATING
193rd/ 347
METRIC RANK
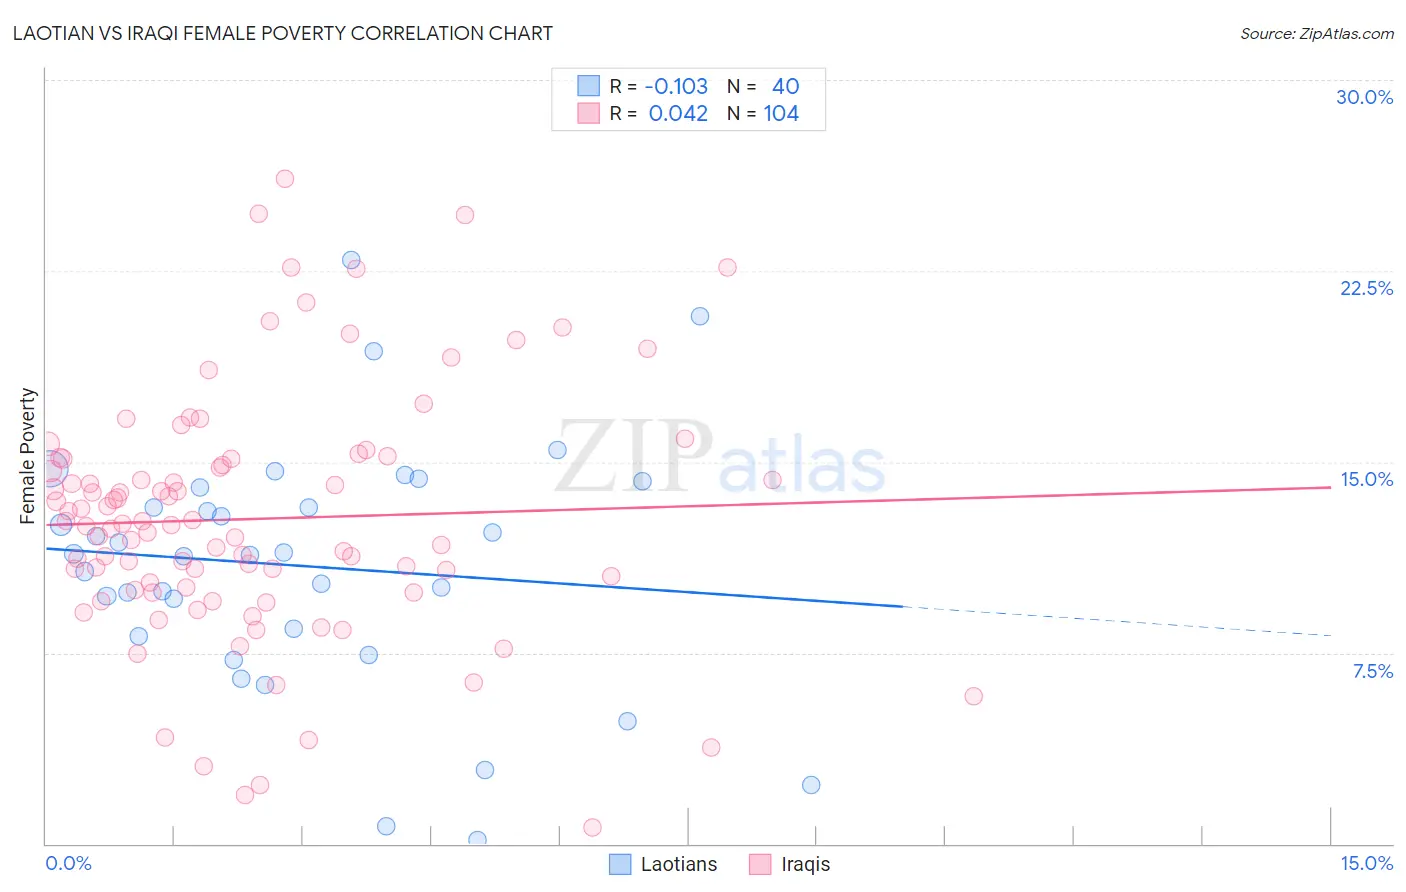
Laotian vs Iraqi Female Poverty Correlation Chart
The statistical analysis conducted on geographies consisting of 224,727,554 people shows a poor negative correlation between the proportion of Laotians and poverty level among females in the United States with a correlation coefficient (R) of -0.103 and weighted average of 12.6%. Similarly, the statistical analysis conducted on geographies consisting of 170,556,869 people shows no correlation between the proportion of Iraqis and poverty level among females in the United States with a correlation coefficient (R) of 0.042 and weighted average of 13.7%, a difference of 8.8%.
Female Poverty Correlation Summary
| Measurement | Laotian | Iraqi |
| Minimum | 0.15% | 0.62% |
| Maximum | 22.9% | 26.1% |
| Range | 22.8% | 25.5% |
| Mean | 10.9% | 12.8% |
| Median | 11.4% | 12.5% |
| Interquartile 25% (IQ1) | 8.3% | 10.0% |
| Interquartile 75% (IQ3) | 13.6% | 15.1% |
| Interquartile Range (IQR) | 5.3% | 5.1% |
| Standard Deviation (Sample) | 4.8% | 4.9% |
| Standard Deviation (Population) | 4.8% | 4.9% |
Similar Demographics by Female Poverty
Demographics Similar to Laotians by Female Poverty
In terms of female poverty, the demographic groups most similar to Laotians are Portuguese (12.6%, a difference of 0.10%), Immigrants from Zimbabwe (12.6%, a difference of 0.12%), Paraguayan (12.6%, a difference of 0.15%), Immigrants from Turkey (12.6%, a difference of 0.19%), and Scottish (12.5%, a difference of 0.31%).
| Demographics | Rating | Rank | Female Poverty |
| Immigrants | Latvia | 94.8 /100 | #100 | Exceptional 12.5% |
| Tlingit-Haida | 94.8 /100 | #101 | Exceptional 12.5% |
| Immigrants | China | 94.5 /100 | #102 | Exceptional 12.5% |
| Slavs | 94.5 /100 | #103 | Exceptional 12.5% |
| Palestinians | 94.3 /100 | #104 | Exceptional 12.5% |
| Scottish | 94.1 /100 | #105 | Exceptional 12.5% |
| Immigrants | Turkey | 93.8 /100 | #106 | Exceptional 12.6% |
| Laotians | 93.4 /100 | #107 | Exceptional 12.6% |
| Portuguese | 93.1 /100 | #108 | Exceptional 12.6% |
| Immigrants | Zimbabwe | 93.1 /100 | #109 | Exceptional 12.6% |
| Paraguayans | 93.0 /100 | #110 | Exceptional 12.6% |
| Soviet Union | 92.4 /100 | #111 | Exceptional 12.6% |
| Immigrants | Israel | 92.0 /100 | #112 | Exceptional 12.6% |
| Canadians | 92.0 /100 | #113 | Exceptional 12.7% |
| Welsh | 91.6 /100 | #114 | Exceptional 12.7% |
Demographics Similar to Iraqis by Female Poverty
In terms of female poverty, the demographic groups most similar to Iraqis are Immigrants from Costa Rica (13.7%, a difference of 0.020%), Delaware (13.7%, a difference of 0.070%), Immigrants from Kuwait (13.7%, a difference of 0.10%), Immigrants from South America (13.7%, a difference of 0.12%), and Sierra Leonean (13.7%, a difference of 0.14%).
| Demographics | Rating | Rank | Female Poverty |
| Immigrants | Portugal | 41.5 /100 | #186 | Average 13.6% |
| Immigrants | Venezuela | 41.0 /100 | #187 | Average 13.6% |
| Hawaiians | 39.9 /100 | #188 | Fair 13.6% |
| Uruguayans | 39.8 /100 | #189 | Fair 13.6% |
| Sierra Leoneans | 33.1 /100 | #190 | Fair 13.7% |
| Immigrants | Kuwait | 32.7 /100 | #191 | Fair 13.7% |
| Immigrants | Costa Rica | 31.9 /100 | #192 | Fair 13.7% |
| Iraqis | 31.8 /100 | #193 | Fair 13.7% |
| Delaware | 31.1 /100 | #194 | Fair 13.7% |
| Immigrants | South America | 30.6 /100 | #195 | Fair 13.7% |
| South American Indians | 28.9 /100 | #196 | Fair 13.7% |
| Arabs | 28.6 /100 | #197 | Fair 13.7% |
| Immigrants | Uganda | 28.5 /100 | #198 | Fair 13.7% |
| Immigrants | Lebanon | 25.6 /100 | #199 | Fair 13.8% |
| Spanish | 21.4 /100 | #200 | Fair 13.9% |