Cherokee vs Immigrants from Latvia In Labor Force | Age 16-19
COMPARE
Cherokee
Immigrants from Latvia
In Labor Force | Age 16-19
In Labor Force | Age 16-19 Comparison
Cherokee
Immigrants from Latvia
40.2%
IN LABOR FORCE | AGE 16-19
100.0/ 100
METRIC RATING
62nd/ 347
METRIC RANK
36.8%
IN LABOR FORCE | AGE 16-19
61.6/ 100
METRIC RATING
169th/ 347
METRIC RANK
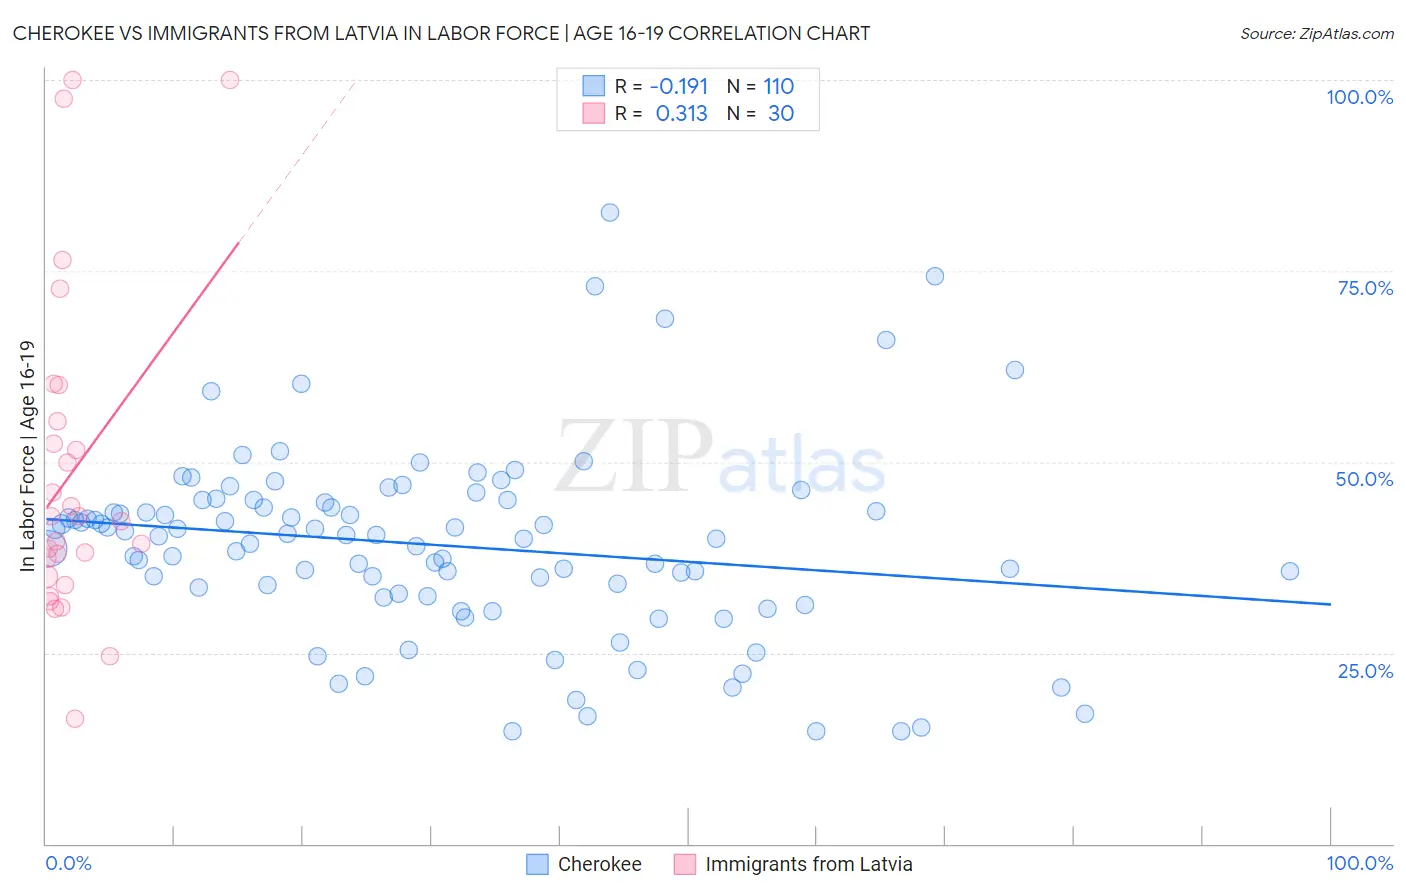
Cherokee vs Immigrants from Latvia In Labor Force | Age 16-19 Correlation Chart
The statistical analysis conducted on geographies consisting of 492,065,053 people shows a poor negative correlation between the proportion of Cherokee and labor force participation rate among population between the ages 16 and 19 in the United States with a correlation coefficient (R) of -0.191 and weighted average of 40.2%. Similarly, the statistical analysis conducted on geographies consisting of 113,686,535 people shows a mild positive correlation between the proportion of Immigrants from Latvia and labor force participation rate among population between the ages 16 and 19 in the United States with a correlation coefficient (R) of 0.313 and weighted average of 36.8%, a difference of 9.4%.
In Labor Force | Age 16-19 Correlation Summary
| Measurement | Cherokee | Immigrants from Latvia |
| Minimum | 14.7% | 16.4% |
| Maximum | 82.7% | 100.0% |
| Range | 68.0% | 83.6% |
| Mean | 39.1% | 48.7% |
| Median | 40.3% | 42.6% |
| Interquartile 25% (IQ1) | 32.8% | 35.0% |
| Interquartile 75% (IQ3) | 44.6% | 55.3% |
| Interquartile Range (IQR) | 11.9% | 20.3% |
| Standard Deviation (Sample) | 12.3% | 21.4% |
| Standard Deviation (Population) | 12.3% | 21.1% |
Similar Demographics by In Labor Force | Age 16-19
Demographics Similar to Cherokee by In Labor Force | Age 16-19
In terms of in labor force | age 16-19, the demographic groups most similar to Cherokee are Northern European (40.2%, a difference of 0.060%), American (40.3%, a difference of 0.14%), Immigrants from Micronesia (40.2%, a difference of 0.17%), Kenyan (40.1%, a difference of 0.25%), and Immigrants from Eastern Africa (40.4%, a difference of 0.29%).
| Demographics | Rating | Rank | In Labor Force | Age 16-19 |
| British | 100.0 /100 | #55 | Exceptional 40.5% |
| Fijians | 100.0 /100 | #56 | Exceptional 40.4% |
| Lithuanians | 100.0 /100 | #57 | Exceptional 40.4% |
| Aleuts | 100.0 /100 | #58 | Exceptional 40.4% |
| Slavs | 100.0 /100 | #59 | Exceptional 40.4% |
| Immigrants | Eastern Africa | 100.0 /100 | #60 | Exceptional 40.4% |
| Americans | 100.0 /100 | #61 | Exceptional 40.3% |
| Cherokee | 100.0 /100 | #62 | Exceptional 40.2% |
| Northern Europeans | 100.0 /100 | #63 | Exceptional 40.2% |
| Immigrants | Micronesia | 100.0 /100 | #64 | Exceptional 40.2% |
| Kenyans | 100.0 /100 | #65 | Exceptional 40.1% |
| Immigrants | Nonimmigrants | 100.0 /100 | #66 | Exceptional 40.1% |
| Canadians | 100.0 /100 | #67 | Exceptional 40.1% |
| Italians | 99.9 /100 | #68 | Exceptional 40.1% |
| Potawatomi | 99.9 /100 | #69 | Exceptional 40.0% |
Demographics Similar to Immigrants from Latvia by In Labor Force | Age 16-19
In terms of in labor force | age 16-19, the demographic groups most similar to Immigrants from Latvia are Immigrants from South Africa (36.8%, a difference of 0.060%), Palestinian (36.8%, a difference of 0.080%), Arab (36.8%, a difference of 0.11%), Immigrants from Cambodia (36.7%, a difference of 0.17%), and South African (36.7%, a difference of 0.17%).
| Demographics | Rating | Rank | In Labor Force | Age 16-19 |
| Immigrants | Jordan | 69.5 /100 | #162 | Good 36.9% |
| Bermudans | 69.3 /100 | #163 | Good 36.9% |
| Immigrants | Kuwait | 68.9 /100 | #164 | Good 36.9% |
| Yakama | 66.9 /100 | #165 | Good 36.9% |
| Immigrants | Western Africa | 66.7 /100 | #166 | Good 36.9% |
| Arabs | 63.6 /100 | #167 | Good 36.8% |
| Palestinians | 63.1 /100 | #168 | Good 36.8% |
| Immigrants | Latvia | 61.6 /100 | #169 | Good 36.8% |
| Immigrants | South Africa | 60.5 /100 | #170 | Good 36.8% |
| Immigrants | Cambodia | 58.4 /100 | #171 | Average 36.7% |
| South Africans | 58.3 /100 | #172 | Average 36.7% |
| Russians | 57.5 /100 | #173 | Average 36.7% |
| Immigrants | Czechoslovakia | 50.0 /100 | #174 | Average 36.6% |
| Natives/Alaskans | 49.0 /100 | #175 | Average 36.6% |
| Albanians | 48.8 /100 | #176 | Average 36.5% |