Cherokee vs Immigrants from El Salvador Single Male Poverty
COMPARE
Cherokee
Immigrants from El Salvador
Single Male Poverty
Single Male Poverty Comparison
Cherokee
Immigrants from El Salvador
16.1%
SINGLE MALE POVERTY
0.0/ 100
METRIC RATING
313th/ 347
METRIC RANK
12.6%
SINGLE MALE POVERTY
80.0/ 100
METRIC RATING
138th/ 347
METRIC RANK
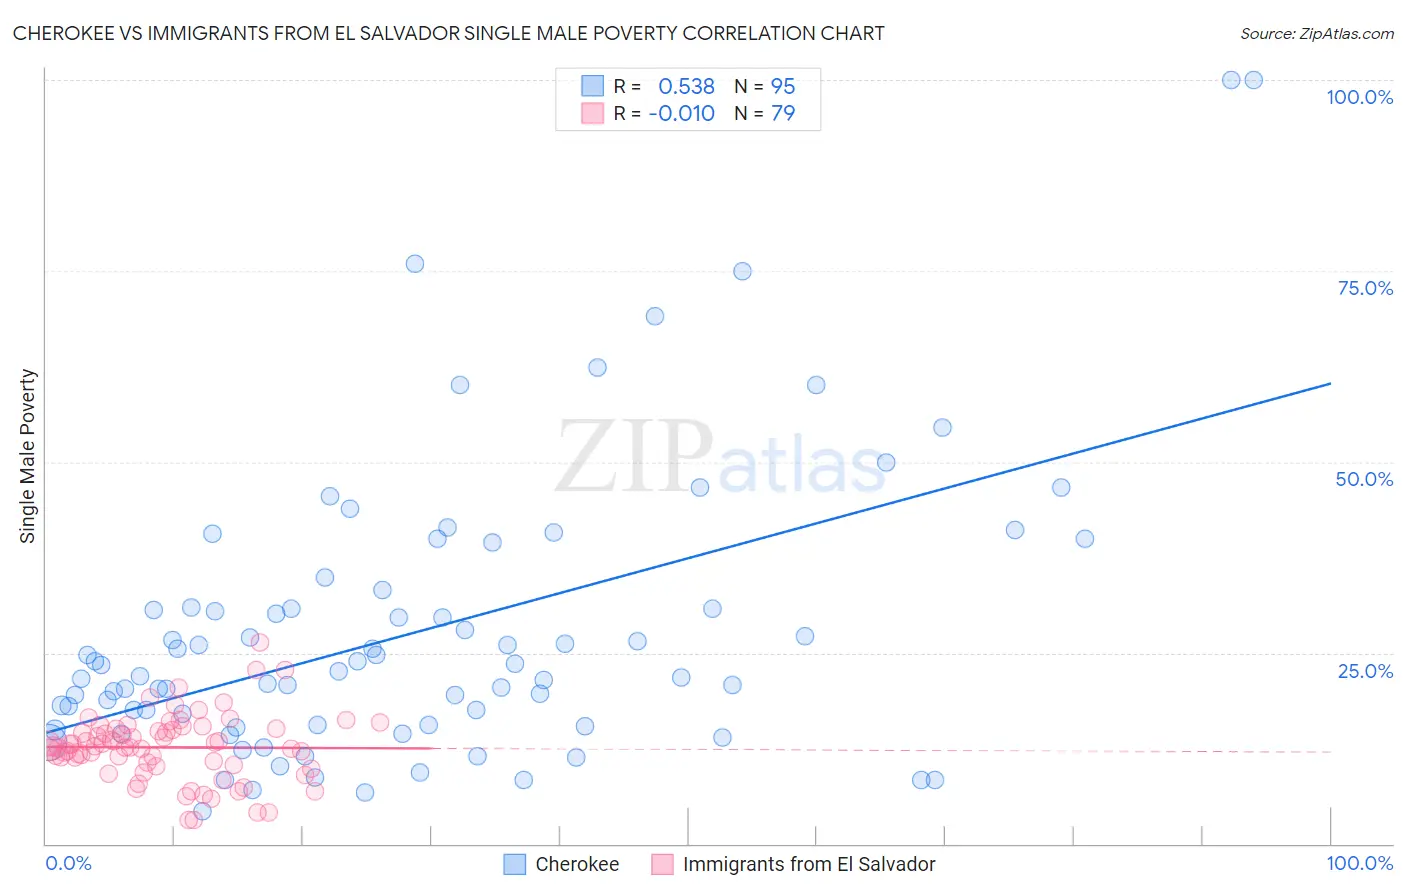
Cherokee vs Immigrants from El Salvador Single Male Poverty Correlation Chart
The statistical analysis conducted on geographies consisting of 428,758,235 people shows a substantial positive correlation between the proportion of Cherokee and poverty level among single males in the United States with a correlation coefficient (R) of 0.538 and weighted average of 16.1%. Similarly, the statistical analysis conducted on geographies consisting of 325,623,225 people shows no correlation between the proportion of Immigrants from El Salvador and poverty level among single males in the United States with a correlation coefficient (R) of -0.010 and weighted average of 12.6%, a difference of 27.8%.
Single Male Poverty Correlation Summary
| Measurement | Cherokee | Immigrants from El Salvador |
| Minimum | 4.3% | 3.1% |
| Maximum | 100.0% | 26.3% |
| Range | 95.7% | 23.3% |
| Mean | 27.7% | 12.6% |
| Median | 22.6% | 12.8% |
| Interquartile 25% (IQ1) | 15.5% | 10.3% |
| Interquartile 75% (IQ3) | 30.9% | 15.1% |
| Interquartile Range (IQR) | 15.4% | 4.7% |
| Standard Deviation (Sample) | 18.5% | 4.3% |
| Standard Deviation (Population) | 18.4% | 4.3% |
Similar Demographics by Single Male Poverty
Demographics Similar to Cherokee by Single Male Poverty
In terms of single male poverty, the demographic groups most similar to Cherokee are Seminole (16.0%, a difference of 0.23%), Comanche (16.0%, a difference of 0.23%), Alaskan Athabascan (16.1%, a difference of 0.29%), Cheyenne (16.1%, a difference of 0.33%), and Dutch West Indian (16.1%, a difference of 0.48%).
| Demographics | Rating | Rank | Single Male Poverty |
| Pennsylvania Germans | 0.0 /100 | #306 | Tragic 15.6% |
| Ute | 0.0 /100 | #307 | Tragic 15.7% |
| Potawatomi | 0.0 /100 | #308 | Tragic 15.8% |
| Americans | 0.0 /100 | #309 | Tragic 15.8% |
| Yakama | 0.0 /100 | #310 | Tragic 15.9% |
| Seminole | 0.0 /100 | #311 | Tragic 16.0% |
| Comanche | 0.0 /100 | #312 | Tragic 16.0% |
| Cherokee | 0.0 /100 | #313 | Tragic 16.1% |
| Alaskan Athabascans | 0.0 /100 | #314 | Tragic 16.1% |
| Cheyenne | 0.0 /100 | #315 | Tragic 16.1% |
| Dutch West Indians | 0.0 /100 | #316 | Tragic 16.1% |
| Blacks/African Americans | 0.0 /100 | #317 | Tragic 16.2% |
| Chickasaw | 0.0 /100 | #318 | Tragic 16.3% |
| Chippewa | 0.0 /100 | #319 | Tragic 16.4% |
| Marshallese | 0.0 /100 | #320 | Tragic 16.4% |
Demographics Similar to Immigrants from El Salvador by Single Male Poverty
In terms of single male poverty, the demographic groups most similar to Immigrants from El Salvador are Cuban (12.6%, a difference of 0.010%), Ukrainian (12.6%, a difference of 0.060%), Immigrants from Costa Rica (12.5%, a difference of 0.16%), Immigrants from Austria (12.5%, a difference of 0.16%), and Immigrants from Zimbabwe (12.6%, a difference of 0.16%).
| Demographics | Rating | Rank | Single Male Poverty |
| Immigrants | Northern Europe | 83.7 /100 | #131 | Excellent 12.5% |
| Salvadorans | 83.7 /100 | #132 | Excellent 12.5% |
| Immigrants | Western Asia | 83.4 /100 | #133 | Excellent 12.5% |
| Immigrants | Ecuador | 82.1 /100 | #134 | Excellent 12.5% |
| Immigrants | Costa Rica | 81.9 /100 | #135 | Excellent 12.5% |
| Immigrants | Austria | 81.9 /100 | #136 | Excellent 12.5% |
| Ukrainians | 80.7 /100 | #137 | Excellent 12.6% |
| Immigrants | El Salvador | 80.0 /100 | #138 | Excellent 12.6% |
| Cubans | 79.9 /100 | #139 | Good 12.6% |
| Immigrants | Zimbabwe | 78.0 /100 | #140 | Good 12.6% |
| Okinawans | 75.9 /100 | #141 | Good 12.6% |
| Immigrants | Uganda | 75.9 /100 | #142 | Good 12.6% |
| Immigrants | France | 75.8 /100 | #143 | Good 12.6% |
| Hawaiians | 75.1 /100 | #144 | Good 12.6% |
| Immigrants | Lebanon | 75.0 /100 | #145 | Good 12.6% |