Cherokee vs Cypriot Single Male Poverty
COMPARE
Cherokee
Cypriot
Single Male Poverty
Single Male Poverty Comparison
Cherokee
Cypriots
16.1%
SINGLE MALE POVERTY
0.0/ 100
METRIC RATING
313th/ 347
METRIC RANK
11.7%
SINGLE MALE POVERTY
99.9/ 100
METRIC RATING
55th/ 347
METRIC RANK
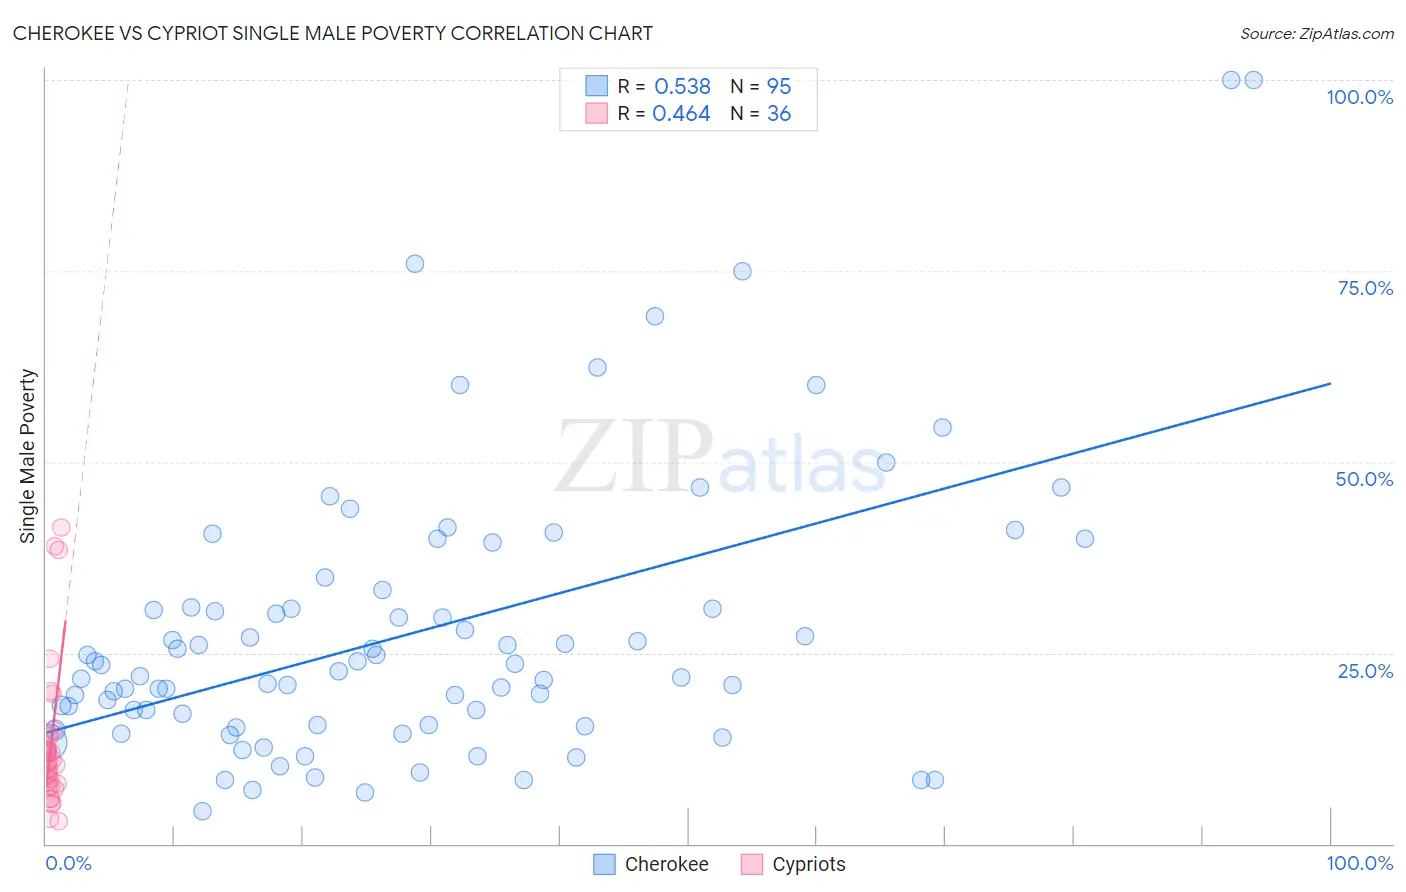
Cherokee vs Cypriot Single Male Poverty Correlation Chart
The statistical analysis conducted on geographies consisting of 428,758,235 people shows a substantial positive correlation between the proportion of Cherokee and poverty level among single males in the United States with a correlation coefficient (R) of 0.538 and weighted average of 16.1%. Similarly, the statistical analysis conducted on geographies consisting of 58,678,740 people shows a moderate positive correlation between the proportion of Cypriots and poverty level among single males in the United States with a correlation coefficient (R) of 0.464 and weighted average of 11.7%, a difference of 37.4%.
Single Male Poverty Correlation Summary
| Measurement | Cherokee | Cypriot |
| Minimum | 4.3% | 2.9% |
| Maximum | 100.0% | 41.4% |
| Range | 95.7% | 38.5% |
| Mean | 27.7% | 12.9% |
| Median | 22.6% | 10.7% |
| Interquartile 25% (IQ1) | 15.5% | 7.7% |
| Interquartile 75% (IQ3) | 30.9% | 13.5% |
| Interquartile Range (IQR) | 15.4% | 5.8% |
| Standard Deviation (Sample) | 18.5% | 9.3% |
| Standard Deviation (Population) | 18.4% | 9.2% |
Similar Demographics by Single Male Poverty
Demographics Similar to Cherokee by Single Male Poverty
In terms of single male poverty, the demographic groups most similar to Cherokee are Seminole (16.0%, a difference of 0.23%), Comanche (16.0%, a difference of 0.23%), Alaskan Athabascan (16.1%, a difference of 0.29%), Cheyenne (16.1%, a difference of 0.33%), and Dutch West Indian (16.1%, a difference of 0.48%).
| Demographics | Rating | Rank | Single Male Poverty |
| Pennsylvania Germans | 0.0 /100 | #306 | Tragic 15.6% |
| Ute | 0.0 /100 | #307 | Tragic 15.7% |
| Potawatomi | 0.0 /100 | #308 | Tragic 15.8% |
| Americans | 0.0 /100 | #309 | Tragic 15.8% |
| Yakama | 0.0 /100 | #310 | Tragic 15.9% |
| Seminole | 0.0 /100 | #311 | Tragic 16.0% |
| Comanche | 0.0 /100 | #312 | Tragic 16.0% |
| Cherokee | 0.0 /100 | #313 | Tragic 16.1% |
| Alaskan Athabascans | 0.0 /100 | #314 | Tragic 16.1% |
| Cheyenne | 0.0 /100 | #315 | Tragic 16.1% |
| Dutch West Indians | 0.0 /100 | #316 | Tragic 16.1% |
| Blacks/African Americans | 0.0 /100 | #317 | Tragic 16.2% |
| Chickasaw | 0.0 /100 | #318 | Tragic 16.3% |
| Chippewa | 0.0 /100 | #319 | Tragic 16.4% |
| Marshallese | 0.0 /100 | #320 | Tragic 16.4% |
Demographics Similar to Cypriots by Single Male Poverty
In terms of single male poverty, the demographic groups most similar to Cypriots are Immigrants from Uzbekistan (11.7%, a difference of 0.17%), Bulgarian (11.7%, a difference of 0.19%), Samoan (11.7%, a difference of 0.29%), Burmese (11.7%, a difference of 0.31%), and Immigrants from Romania (11.7%, a difference of 0.46%).
| Demographics | Rating | Rank | Single Male Poverty |
| Immigrants | Indonesia | 99.9 /100 | #48 | Exceptional 11.6% |
| Tlingit-Haida | 99.9 /100 | #49 | Exceptional 11.6% |
| Immigrants | Lithuania | 99.9 /100 | #50 | Exceptional 11.6% |
| Paraguayans | 99.9 /100 | #51 | Exceptional 11.6% |
| Samoans | 99.9 /100 | #52 | Exceptional 11.7% |
| Bulgarians | 99.9 /100 | #53 | Exceptional 11.7% |
| Immigrants | Uzbekistan | 99.9 /100 | #54 | Exceptional 11.7% |
| Cypriots | 99.9 /100 | #55 | Exceptional 11.7% |
| Burmese | 99.8 /100 | #56 | Exceptional 11.7% |
| Immigrants | Romania | 99.8 /100 | #57 | Exceptional 11.7% |
| Immigrants | Brazil | 99.8 /100 | #58 | Exceptional 11.7% |
| Brazilians | 99.8 /100 | #59 | Exceptional 11.8% |
| Peruvians | 99.8 /100 | #60 | Exceptional 11.8% |
| Cambodians | 99.8 /100 | #61 | Exceptional 11.8% |
| Immigrants | Sri Lanka | 99.7 /100 | #62 | Exceptional 11.8% |