Cherokee vs Immigrants from Scotland Single Male Poverty
COMPARE
Cherokee
Immigrants from Scotland
Single Male Poverty
Single Male Poverty Comparison
Cherokee
Immigrants from Scotland
16.1%
SINGLE MALE POVERTY
0.0/ 100
METRIC RATING
313th/ 347
METRIC RANK
12.7%
SINGLE MALE POVERTY
68.9/ 100
METRIC RATING
154th/ 347
METRIC RANK
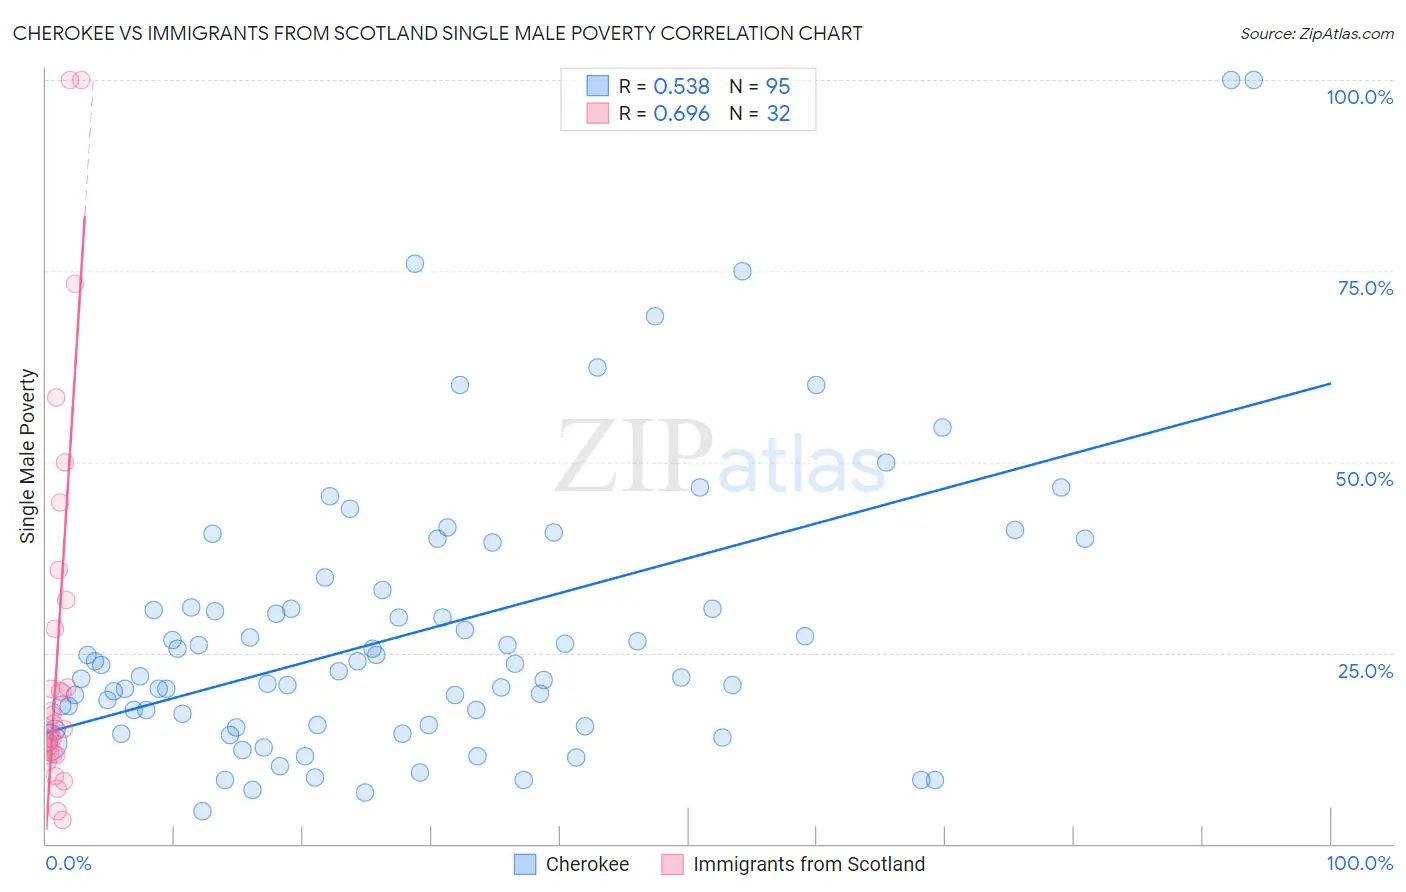
Cherokee vs Immigrants from Scotland Single Male Poverty Correlation Chart
The statistical analysis conducted on geographies consisting of 428,758,235 people shows a substantial positive correlation between the proportion of Cherokee and poverty level among single males in the United States with a correlation coefficient (R) of 0.538 and weighted average of 16.1%. Similarly, the statistical analysis conducted on geographies consisting of 179,195,649 people shows a significant positive correlation between the proportion of Immigrants from Scotland and poverty level among single males in the United States with a correlation coefficient (R) of 0.696 and weighted average of 12.7%, a difference of 26.8%.
Single Male Poverty Correlation Summary
| Measurement | Cherokee | Immigrants from Scotland |
| Minimum | 4.3% | 3.1% |
| Maximum | 100.0% | 100.0% |
| Range | 95.7% | 96.9% |
| Mean | 27.7% | 25.8% |
| Median | 22.6% | 15.4% |
| Interquartile 25% (IQ1) | 15.5% | 11.9% |
| Interquartile 75% (IQ3) | 30.9% | 30.0% |
| Interquartile Range (IQR) | 15.4% | 18.1% |
| Standard Deviation (Sample) | 18.5% | 25.1% |
| Standard Deviation (Population) | 18.4% | 24.7% |
Similar Demographics by Single Male Poverty
Demographics Similar to Cherokee by Single Male Poverty
In terms of single male poverty, the demographic groups most similar to Cherokee are Seminole (16.0%, a difference of 0.23%), Comanche (16.0%, a difference of 0.23%), Alaskan Athabascan (16.1%, a difference of 0.29%), Cheyenne (16.1%, a difference of 0.33%), and Dutch West Indian (16.1%, a difference of 0.48%).
| Demographics | Rating | Rank | Single Male Poverty |
| Pennsylvania Germans | 0.0 /100 | #306 | Tragic 15.6% |
| Ute | 0.0 /100 | #307 | Tragic 15.7% |
| Potawatomi | 0.0 /100 | #308 | Tragic 15.8% |
| Americans | 0.0 /100 | #309 | Tragic 15.8% |
| Yakama | 0.0 /100 | #310 | Tragic 15.9% |
| Seminole | 0.0 /100 | #311 | Tragic 16.0% |
| Comanche | 0.0 /100 | #312 | Tragic 16.0% |
| Cherokee | 0.0 /100 | #313 | Tragic 16.1% |
| Alaskan Athabascans | 0.0 /100 | #314 | Tragic 16.1% |
| Cheyenne | 0.0 /100 | #315 | Tragic 16.1% |
| Dutch West Indians | 0.0 /100 | #316 | Tragic 16.1% |
| Blacks/African Americans | 0.0 /100 | #317 | Tragic 16.2% |
| Chickasaw | 0.0 /100 | #318 | Tragic 16.3% |
| Chippewa | 0.0 /100 | #319 | Tragic 16.4% |
| Marshallese | 0.0 /100 | #320 | Tragic 16.4% |
Demographics Similar to Immigrants from Scotland by Single Male Poverty
In terms of single male poverty, the demographic groups most similar to Immigrants from Scotland are Immigrants from Spain (12.7%, a difference of 0.020%), Vietnamese (12.7%, a difference of 0.060%), Latvian (12.7%, a difference of 0.060%), Immigrants (12.7%, a difference of 0.070%), and Australian (12.6%, a difference of 0.16%).
| Demographics | Rating | Rank | Single Male Poverty |
| Malaysians | 74.8 /100 | #147 | Good 12.6% |
| Yugoslavians | 73.9 /100 | #148 | Good 12.6% |
| Sierra Leoneans | 73.0 /100 | #149 | Good 12.6% |
| Immigrants | Panama | 72.1 /100 | #150 | Good 12.6% |
| Immigrants | Hungary | 71.9 /100 | #151 | Good 12.6% |
| Australians | 71.4 /100 | #152 | Good 12.6% |
| Immigrants | Immigrants | 70.1 /100 | #153 | Good 12.7% |
| Immigrants | Scotland | 68.9 /100 | #154 | Good 12.7% |
| Immigrants | Spain | 68.7 /100 | #155 | Good 12.7% |
| Vietnamese | 67.9 /100 | #156 | Good 12.7% |
| Latvians | 67.9 /100 | #157 | Good 12.7% |
| Immigrants | Middle Africa | 64.9 /100 | #158 | Good 12.7% |
| Immigrants | Liberia | 64.2 /100 | #159 | Good 12.7% |
| Greeks | 64.1 /100 | #160 | Good 12.7% |
| Immigrants | Africa | 63.4 /100 | #161 | Good 12.7% |