Japanese vs Ukrainian Single Male Poverty
COMPARE
Japanese
Ukrainian
Single Male Poverty
Single Male Poverty Comparison
Japanese
Ukrainians
13.1%
SINGLE MALE POVERTY
14.8/ 100
METRIC RATING
215th/ 347
METRIC RANK
12.6%
SINGLE MALE POVERTY
80.7/ 100
METRIC RATING
137th/ 347
METRIC RANK
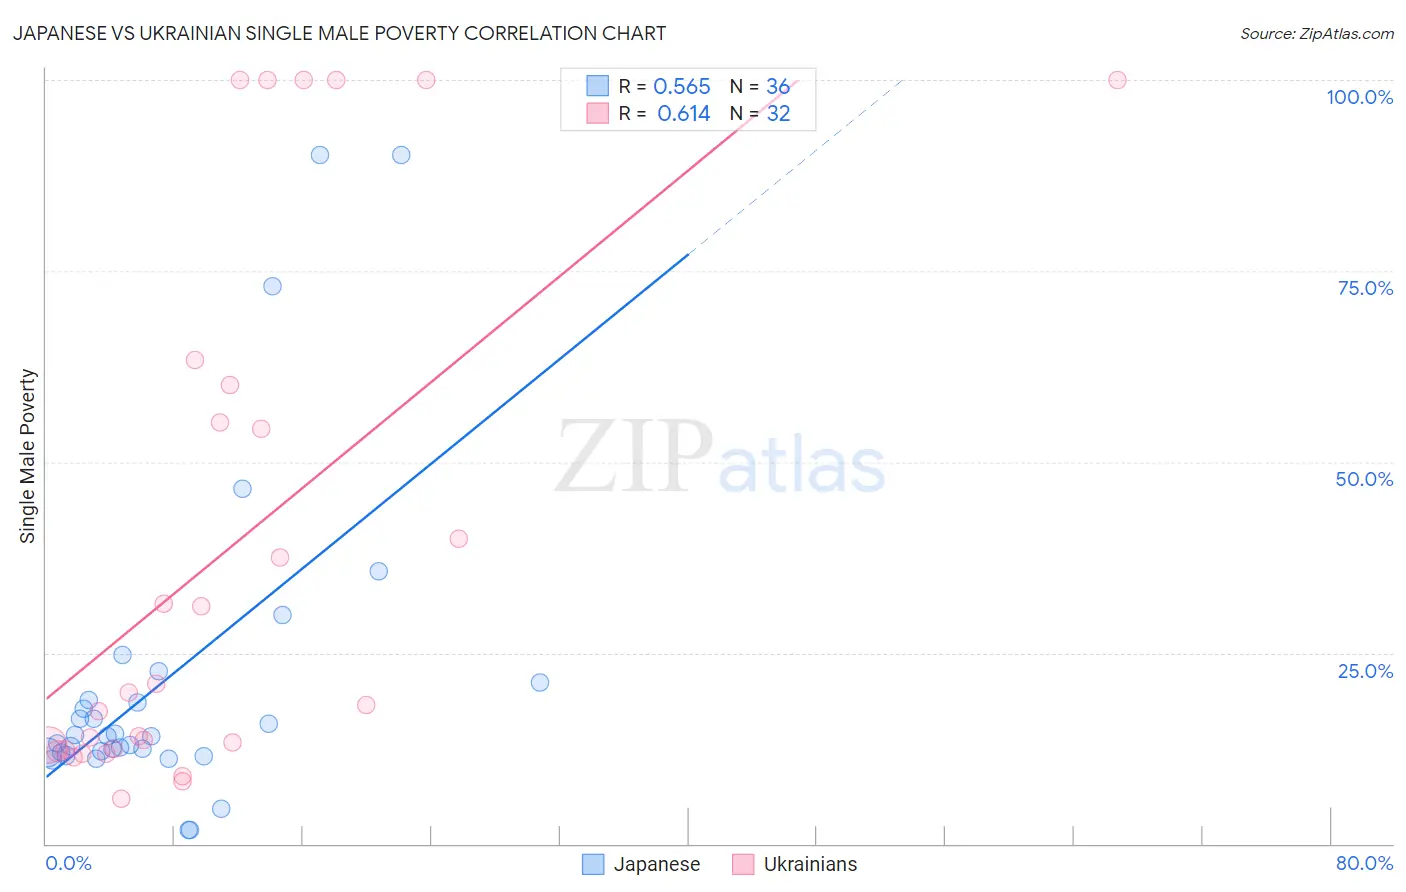
Japanese vs Ukrainian Single Male Poverty Correlation Chart
The statistical analysis conducted on geographies consisting of 231,157,970 people shows a substantial positive correlation between the proportion of Japanese and poverty level among single males in the United States with a correlation coefficient (R) of 0.565 and weighted average of 13.1%. Similarly, the statistical analysis conducted on geographies consisting of 384,483,508 people shows a significant positive correlation between the proportion of Ukrainians and poverty level among single males in the United States with a correlation coefficient (R) of 0.614 and weighted average of 12.6%, a difference of 4.3%.
Single Male Poverty Correlation Summary
| Measurement | Japanese | Ukrainian |
| Minimum | 1.7% | 6.0% |
| Maximum | 90.1% | 100.0% |
| Range | 88.4% | 94.0% |
| Mean | 21.4% | 37.9% |
| Median | 14.1% | 19.0% |
| Interquartile 25% (IQ1) | 12.0% | 12.3% |
| Interquartile 75% (IQ3) | 20.0% | 57.6% |
| Interquartile Range (IQR) | 8.0% | 45.2% |
| Standard Deviation (Sample) | 21.1% | 34.1% |
| Standard Deviation (Population) | 20.8% | 33.6% |
Similar Demographics by Single Male Poverty
Demographics Similar to Japanese by Single Male Poverty
In terms of single male poverty, the demographic groups most similar to Japanese are Zimbabwean (13.1%, a difference of 0.010%), Austrian (13.1%, a difference of 0.090%), Italian (13.1%, a difference of 0.11%), Senegalese (13.1%, a difference of 0.16%), and Swedish (13.1%, a difference of 0.19%).
| Demographics | Rating | Rank | Single Male Poverty |
| Immigrants | Western Africa | 17.6 /100 | #208 | Poor 13.1% |
| Mexican American Indians | 17.5 /100 | #209 | Poor 13.1% |
| Immigrants | Haiti | 16.8 /100 | #210 | Poor 13.1% |
| Swedes | 16.8 /100 | #211 | Poor 13.1% |
| Senegalese | 16.4 /100 | #212 | Poor 13.1% |
| Italians | 15.9 /100 | #213 | Poor 13.1% |
| Zimbabweans | 14.9 /100 | #214 | Poor 13.1% |
| Japanese | 14.8 /100 | #215 | Poor 13.1% |
| Austrians | 13.9 /100 | #216 | Poor 13.1% |
| Bermudans | 13.0 /100 | #217 | Poor 13.1% |
| Scandinavians | 12.9 /100 | #218 | Poor 13.1% |
| Immigrants | Burma/Myanmar | 12.6 /100 | #219 | Poor 13.1% |
| Central Americans | 10.9 /100 | #220 | Poor 13.2% |
| New Zealanders | 10.7 /100 | #221 | Poor 13.2% |
| Immigrants | Western Europe | 10.0 /100 | #222 | Poor 13.2% |
Demographics Similar to Ukrainians by Single Male Poverty
In terms of single male poverty, the demographic groups most similar to Ukrainians are Immigrants from El Salvador (12.6%, a difference of 0.060%), Cuban (12.6%, a difference of 0.070%), Immigrants from Costa Rica (12.5%, a difference of 0.11%), Immigrants from Austria (12.5%, a difference of 0.11%), and Immigrants from Ecuador (12.5%, a difference of 0.12%).
| Demographics | Rating | Rank | Single Male Poverty |
| Immigrants | Nicaragua | 84.8 /100 | #130 | Excellent 12.5% |
| Immigrants | Northern Europe | 83.7 /100 | #131 | Excellent 12.5% |
| Salvadorans | 83.7 /100 | #132 | Excellent 12.5% |
| Immigrants | Western Asia | 83.4 /100 | #133 | Excellent 12.5% |
| Immigrants | Ecuador | 82.1 /100 | #134 | Excellent 12.5% |
| Immigrants | Costa Rica | 81.9 /100 | #135 | Excellent 12.5% |
| Immigrants | Austria | 81.9 /100 | #136 | Excellent 12.5% |
| Ukrainians | 80.7 /100 | #137 | Excellent 12.6% |
| Immigrants | El Salvador | 80.0 /100 | #138 | Excellent 12.6% |
| Cubans | 79.9 /100 | #139 | Good 12.6% |
| Immigrants | Zimbabwe | 78.0 /100 | #140 | Good 12.6% |
| Okinawans | 75.9 /100 | #141 | Good 12.6% |
| Immigrants | Uganda | 75.9 /100 | #142 | Good 12.6% |
| Immigrants | France | 75.8 /100 | #143 | Good 12.6% |
| Hawaiians | 75.1 /100 | #144 | Good 12.6% |