Immigrants from Belgium vs Ukrainian Single Male Poverty
COMPARE
Immigrants from Belgium
Ukrainian
Single Male Poverty
Single Male Poverty Comparison
Immigrants from Belgium
Ukrainians
12.0%
SINGLE MALE POVERTY
99.0/ 100
METRIC RATING
79th/ 347
METRIC RANK
12.6%
SINGLE MALE POVERTY
80.7/ 100
METRIC RATING
137th/ 347
METRIC RANK
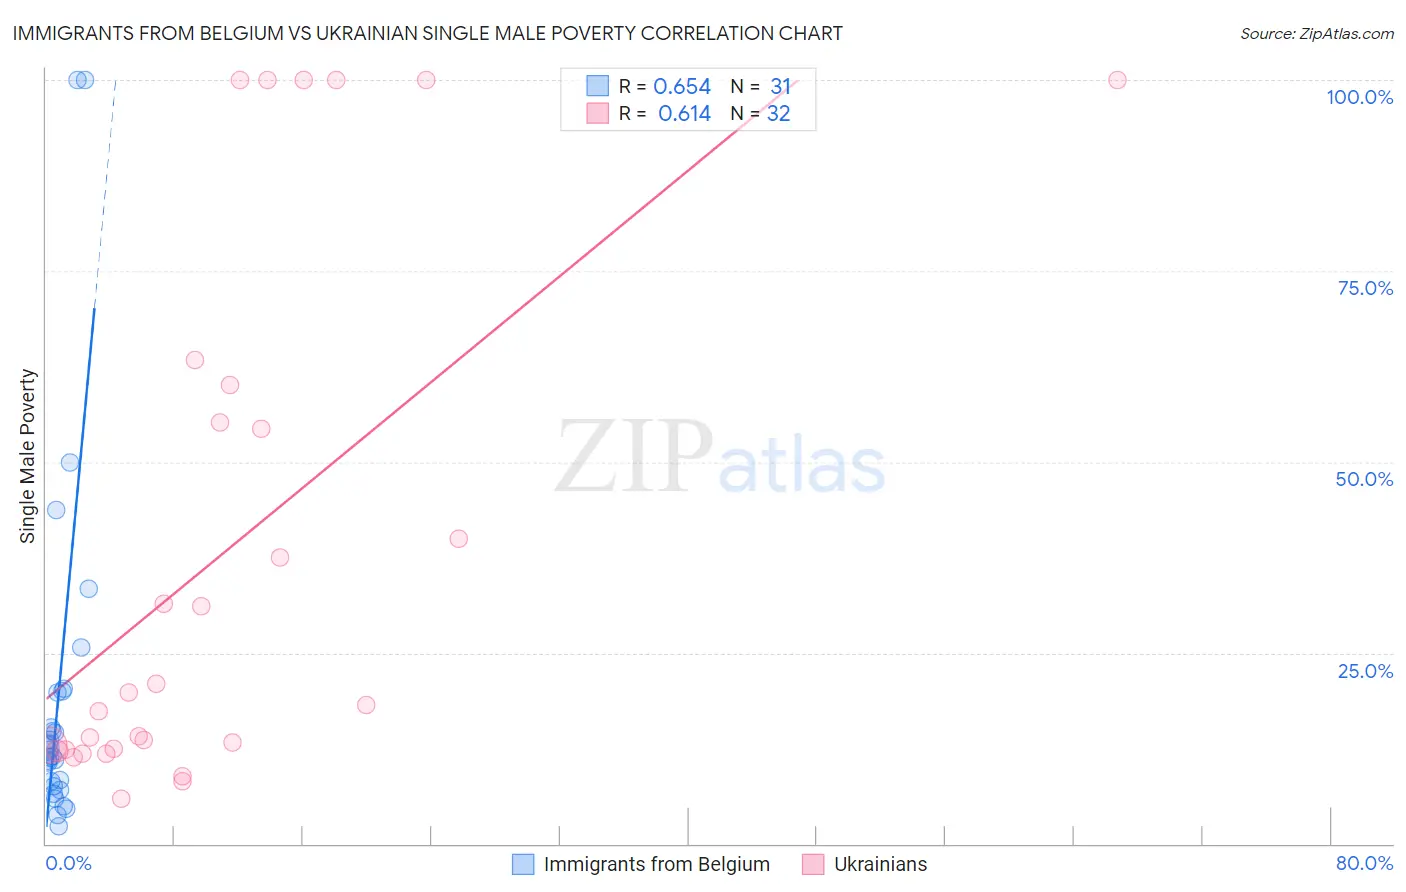
Immigrants from Belgium vs Ukrainian Single Male Poverty Correlation Chart
The statistical analysis conducted on geographies consisting of 135,973,123 people shows a significant positive correlation between the proportion of Immigrants from Belgium and poverty level among single males in the United States with a correlation coefficient (R) of 0.654 and weighted average of 12.0%. Similarly, the statistical analysis conducted on geographies consisting of 384,483,508 people shows a significant positive correlation between the proportion of Ukrainians and poverty level among single males in the United States with a correlation coefficient (R) of 0.614 and weighted average of 12.6%, a difference of 4.5%.
Single Male Poverty Correlation Summary
| Measurement | Immigrants from Belgium | Ukrainian |
| Minimum | 2.4% | 6.0% |
| Maximum | 100.0% | 100.0% |
| Range | 97.6% | 94.0% |
| Mean | 20.1% | 37.9% |
| Median | 12.3% | 19.0% |
| Interquartile 25% (IQ1) | 7.5% | 12.3% |
| Interquartile 75% (IQ3) | 20.0% | 57.6% |
| Interquartile Range (IQR) | 12.5% | 45.2% |
| Standard Deviation (Sample) | 23.9% | 34.1% |
| Standard Deviation (Population) | 23.5% | 33.6% |
Similar Demographics by Single Male Poverty
Demographics Similar to Immigrants from Belgium by Single Male Poverty
In terms of single male poverty, the demographic groups most similar to Immigrants from Belgium are Immigrants from Venezuela (12.0%, a difference of 0.10%), Immigrants from Malaysia (12.0%, a difference of 0.36%), Armenian (12.1%, a difference of 0.44%), Immigrants from South America (12.1%, a difference of 0.46%), and Immigrants from Colombia (12.1%, a difference of 0.52%).
| Demographics | Rating | Rank | Single Male Poverty |
| Immigrants | Argentina | 99.5 /100 | #72 | Exceptional 11.9% |
| Argentineans | 99.5 /100 | #73 | Exceptional 11.9% |
| Chileans | 99.5 /100 | #74 | Exceptional 11.9% |
| Uruguayans | 99.4 /100 | #75 | Exceptional 11.9% |
| Immigrants | Northern Africa | 99.4 /100 | #76 | Exceptional 11.9% |
| Immigrants | Malaysia | 99.2 /100 | #77 | Exceptional 12.0% |
| Immigrants | Venezuela | 99.1 /100 | #78 | Exceptional 12.0% |
| Immigrants | Belgium | 99.0 /100 | #79 | Exceptional 12.0% |
| Armenians | 98.7 /100 | #80 | Exceptional 12.1% |
| Immigrants | South America | 98.7 /100 | #81 | Exceptional 12.1% |
| Immigrants | Colombia | 98.6 /100 | #82 | Exceptional 12.1% |
| Immigrants | Chile | 98.6 /100 | #83 | Exceptional 12.1% |
| Immigrants | Czechoslovakia | 98.6 /100 | #84 | Exceptional 12.1% |
| Turks | 98.5 /100 | #85 | Exceptional 12.1% |
| Immigrants | Israel | 98.5 /100 | #86 | Exceptional 12.1% |
Demographics Similar to Ukrainians by Single Male Poverty
In terms of single male poverty, the demographic groups most similar to Ukrainians are Immigrants from El Salvador (12.6%, a difference of 0.060%), Cuban (12.6%, a difference of 0.070%), Immigrants from Costa Rica (12.5%, a difference of 0.11%), Immigrants from Austria (12.5%, a difference of 0.11%), and Immigrants from Ecuador (12.5%, a difference of 0.12%).
| Demographics | Rating | Rank | Single Male Poverty |
| Immigrants | Nicaragua | 84.8 /100 | #130 | Excellent 12.5% |
| Immigrants | Northern Europe | 83.7 /100 | #131 | Excellent 12.5% |
| Salvadorans | 83.7 /100 | #132 | Excellent 12.5% |
| Immigrants | Western Asia | 83.4 /100 | #133 | Excellent 12.5% |
| Immigrants | Ecuador | 82.1 /100 | #134 | Excellent 12.5% |
| Immigrants | Costa Rica | 81.9 /100 | #135 | Excellent 12.5% |
| Immigrants | Austria | 81.9 /100 | #136 | Excellent 12.5% |
| Ukrainians | 80.7 /100 | #137 | Excellent 12.6% |
| Immigrants | El Salvador | 80.0 /100 | #138 | Excellent 12.6% |
| Cubans | 79.9 /100 | #139 | Good 12.6% |
| Immigrants | Zimbabwe | 78.0 /100 | #140 | Good 12.6% |
| Okinawans | 75.9 /100 | #141 | Good 12.6% |
| Immigrants | Uganda | 75.9 /100 | #142 | Good 12.6% |
| Immigrants | France | 75.8 /100 | #143 | Good 12.6% |
| Hawaiians | 75.1 /100 | #144 | Good 12.6% |