Celtic vs Lumbee Male Poverty
COMPARE
Celtic
Lumbee
Male Poverty
Male Poverty Comparison
Celtics
Lumbee
11.2%
MALE POVERTY
47.5/ 100
METRIC RATING
175th/ 347
METRIC RANK
20.2%
MALE POVERTY
0.0/ 100
METRIC RATING
341st/ 347
METRIC RANK
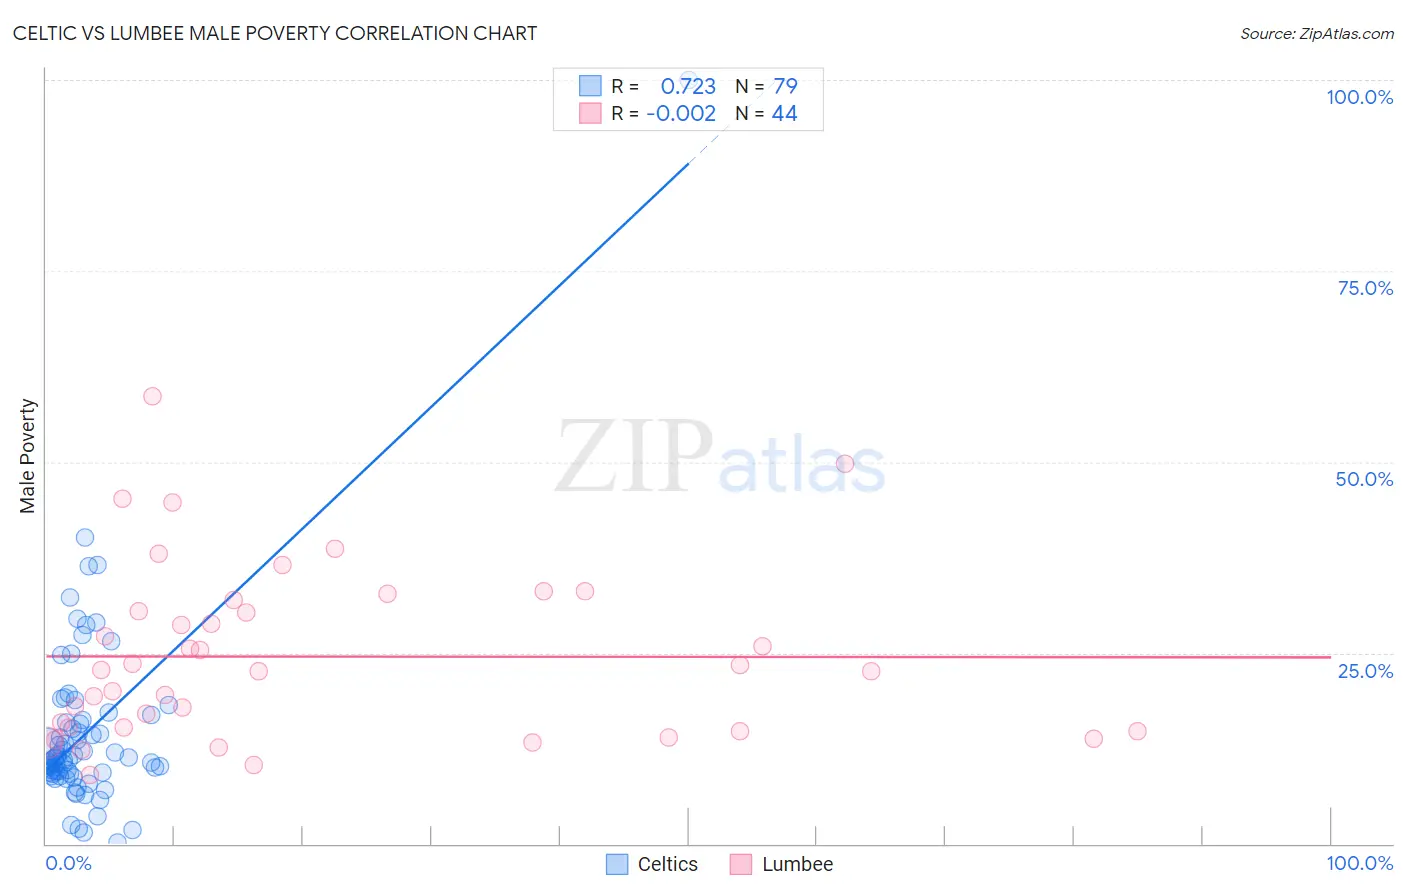
Celtic vs Lumbee Male Poverty Correlation Chart
The statistical analysis conducted on geographies consisting of 168,829,630 people shows a strong positive correlation between the proportion of Celtics and poverty level among males in the United States with a correlation coefficient (R) of 0.723 and weighted average of 11.2%. Similarly, the statistical analysis conducted on geographies consisting of 92,248,821 people shows no correlation between the proportion of Lumbee and poverty level among males in the United States with a correlation coefficient (R) of -0.002 and weighted average of 20.2%, a difference of 80.2%.
Male Poverty Correlation Summary
| Measurement | Celtic | Lumbee |
| Minimum | 0.22% | 9.1% |
| Maximum | 100.0% | 58.5% |
| Range | 99.8% | 49.5% |
| Mean | 14.6% | 24.5% |
| Median | 11.2% | 22.7% |
| Interquartile 25% (IQ1) | 9.2% | 15.0% |
| Interquartile 75% (IQ3) | 16.2% | 31.2% |
| Interquartile Range (IQR) | 6.9% | 16.2% |
| Standard Deviation (Sample) | 12.7% | 11.3% |
| Standard Deviation (Population) | 12.6% | 11.2% |
Similar Demographics by Male Poverty
Demographics Similar to Celtics by Male Poverty
In terms of male poverty, the demographic groups most similar to Celtics are Immigrants from Fiji (11.2%, a difference of 0.14%), Lebanese (11.2%, a difference of 0.18%), Immigrants from Oceania (11.2%, a difference of 0.25%), Pennsylvania German (11.2%, a difference of 0.29%), and Immigrants from Cameroon (11.2%, a difference of 0.29%).
| Demographics | Rating | Rank | Male Poverty |
| Immigrants | Portugal | 54.9 /100 | #168 | Average 11.1% |
| Immigrants | Colombia | 54.2 /100 | #169 | Average 11.1% |
| South Americans | 53.8 /100 | #170 | Average 11.1% |
| Uruguayans | 51.0 /100 | #171 | Average 11.2% |
| Immigrants | Ethiopia | 50.7 /100 | #172 | Average 11.2% |
| Pennsylvania Germans | 50.5 /100 | #173 | Average 11.2% |
| Immigrants | Oceania | 50.0 /100 | #174 | Average 11.2% |
| Celtics | 47.5 /100 | #175 | Average 11.2% |
| Immigrants | Fiji | 46.0 /100 | #176 | Average 11.2% |
| Lebanese | 45.6 /100 | #177 | Average 11.2% |
| Immigrants | Cameroon | 44.5 /100 | #178 | Average 11.2% |
| Immigrants | Syria | 40.3 /100 | #179 | Average 11.3% |
| Immigrants | Morocco | 40.1 /100 | #180 | Average 11.3% |
| Immigrants | Costa Rica | 39.5 /100 | #181 | Fair 11.3% |
| Mongolians | 39.0 /100 | #182 | Fair 11.3% |
Demographics Similar to Lumbee by Male Poverty
In terms of male poverty, the demographic groups most similar to Lumbee are Immigrants from Yemen (20.1%, a difference of 0.30%), Pima (20.4%, a difference of 0.78%), Yup'ik (20.4%, a difference of 0.88%), Hopi (20.8%, a difference of 3.0%), and Yuman (19.5%, a difference of 3.4%).
| Demographics | Rating | Rank | Male Poverty |
| Natives/Alaskans | 0.0 /100 | #333 | Tragic 16.9% |
| Cheyenne | 0.0 /100 | #334 | Tragic 17.6% |
| Apache | 0.0 /100 | #335 | Tragic 17.7% |
| Pueblo | 0.0 /100 | #336 | Tragic 18.5% |
| Sioux | 0.0 /100 | #337 | Tragic 18.7% |
| Crow | 0.0 /100 | #338 | Tragic 19.1% |
| Yuman | 0.0 /100 | #339 | Tragic 19.5% |
| Immigrants | Yemen | 0.0 /100 | #340 | Tragic 20.1% |
| Lumbee | 0.0 /100 | #341 | Tragic 20.2% |
| Pima | 0.0 /100 | #342 | Tragic 20.4% |
| Yup'ik | 0.0 /100 | #343 | Tragic 20.4% |
| Hopi | 0.0 /100 | #344 | Tragic 20.8% |
| Puerto Ricans | 0.0 /100 | #345 | Tragic 22.0% |
| Navajo | 0.0 /100 | #346 | Tragic 22.3% |
| Tohono O'odham | 0.0 /100 | #347 | Tragic 22.9% |