Immigrants from Laos vs Lumbee Male Poverty
COMPARE
Immigrants from Laos
Lumbee
Male Poverty
Male Poverty Comparison
Immigrants from Laos
Lumbee
12.6%
MALE POVERTY
0.5/ 100
METRIC RATING
235th/ 347
METRIC RANK
20.2%
MALE POVERTY
0.0/ 100
METRIC RATING
341st/ 347
METRIC RANK
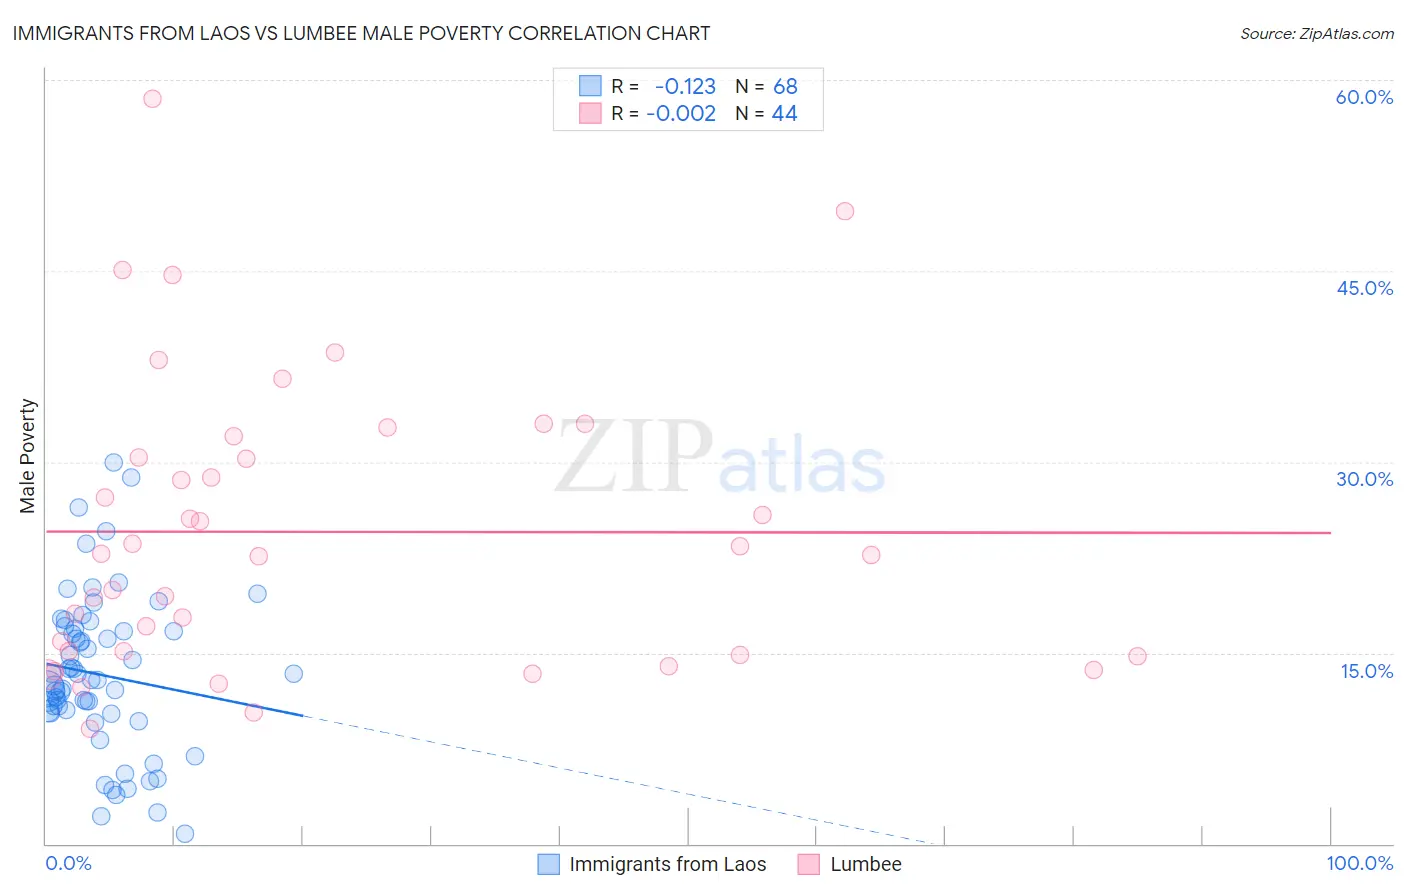
Immigrants from Laos vs Lumbee Male Poverty Correlation Chart
The statistical analysis conducted on geographies consisting of 201,450,990 people shows a poor negative correlation between the proportion of Immigrants from Laos and poverty level among males in the United States with a correlation coefficient (R) of -0.123 and weighted average of 12.6%. Similarly, the statistical analysis conducted on geographies consisting of 92,248,821 people shows no correlation between the proportion of Lumbee and poverty level among males in the United States with a correlation coefficient (R) of -0.002 and weighted average of 20.2%, a difference of 59.9%.
Male Poverty Correlation Summary
| Measurement | Immigrants from Laos | Lumbee |
| Minimum | 0.78% | 9.1% |
| Maximum | 29.9% | 58.5% |
| Range | 29.2% | 49.5% |
| Mean | 13.3% | 24.5% |
| Median | 12.9% | 22.7% |
| Interquartile 25% (IQ1) | 10.3% | 15.0% |
| Interquartile 75% (IQ3) | 16.8% | 31.2% |
| Interquartile Range (IQR) | 6.4% | 16.2% |
| Standard Deviation (Sample) | 6.1% | 11.3% |
| Standard Deviation (Population) | 6.1% | 11.2% |
Similar Demographics by Male Poverty
Demographics Similar to Immigrants from Laos by Male Poverty
In terms of male poverty, the demographic groups most similar to Immigrants from Laos are Immigrants from Saudi Arabia (12.7%, a difference of 0.25%), French American Indian (12.7%, a difference of 0.29%), Ecuadorian (12.7%, a difference of 0.32%), Ghanaian (12.7%, a difference of 0.33%), and Immigrants from Armenia (12.6%, a difference of 0.36%).
| Demographics | Rating | Rank | Male Poverty |
| Alsatians | 1.3 /100 | #228 | Tragic 12.4% |
| Cubans | 1.3 /100 | #229 | Tragic 12.4% |
| Marshallese | 0.8 /100 | #230 | Tragic 12.5% |
| Salvadorans | 0.6 /100 | #231 | Tragic 12.6% |
| Nicaraguans | 0.6 /100 | #232 | Tragic 12.6% |
| Fijians | 0.6 /100 | #233 | Tragic 12.6% |
| Immigrants | Armenia | 0.6 /100 | #234 | Tragic 12.6% |
| Immigrants | Laos | 0.5 /100 | #235 | Tragic 12.6% |
| Immigrants | Saudi Arabia | 0.4 /100 | #236 | Tragic 12.7% |
| French American Indians | 0.4 /100 | #237 | Tragic 12.7% |
| Ecuadorians | 0.4 /100 | #238 | Tragic 12.7% |
| Ghanaians | 0.4 /100 | #239 | Tragic 12.7% |
| Immigrants | Middle Africa | 0.4 /100 | #240 | Tragic 12.7% |
| Sudanese | 0.3 /100 | #241 | Tragic 12.8% |
| Nepalese | 0.3 /100 | #242 | Tragic 12.8% |
Demographics Similar to Lumbee by Male Poverty
In terms of male poverty, the demographic groups most similar to Lumbee are Immigrants from Yemen (20.1%, a difference of 0.30%), Pima (20.4%, a difference of 0.78%), Yup'ik (20.4%, a difference of 0.88%), Hopi (20.8%, a difference of 3.0%), and Yuman (19.5%, a difference of 3.4%).
| Demographics | Rating | Rank | Male Poverty |
| Natives/Alaskans | 0.0 /100 | #333 | Tragic 16.9% |
| Cheyenne | 0.0 /100 | #334 | Tragic 17.6% |
| Apache | 0.0 /100 | #335 | Tragic 17.7% |
| Pueblo | 0.0 /100 | #336 | Tragic 18.5% |
| Sioux | 0.0 /100 | #337 | Tragic 18.7% |
| Crow | 0.0 /100 | #338 | Tragic 19.1% |
| Yuman | 0.0 /100 | #339 | Tragic 19.5% |
| Immigrants | Yemen | 0.0 /100 | #340 | Tragic 20.1% |
| Lumbee | 0.0 /100 | #341 | Tragic 20.2% |
| Pima | 0.0 /100 | #342 | Tragic 20.4% |
| Yup'ik | 0.0 /100 | #343 | Tragic 20.4% |
| Hopi | 0.0 /100 | #344 | Tragic 20.8% |
| Puerto Ricans | 0.0 /100 | #345 | Tragic 22.0% |
| Navajo | 0.0 /100 | #346 | Tragic 22.3% |
| Tohono O'odham | 0.0 /100 | #347 | Tragic 22.9% |