Celtic vs Northern European Male Poverty
COMPARE
Celtic
Northern European
Male Poverty
Male Poverty Comparison
Celtics
Northern Europeans
11.2%
MALE POVERTY
47.5/ 100
METRIC RATING
175th/ 347
METRIC RANK
10.4%
MALE POVERTY
95.2/ 100
METRIC RATING
87th/ 347
METRIC RANK
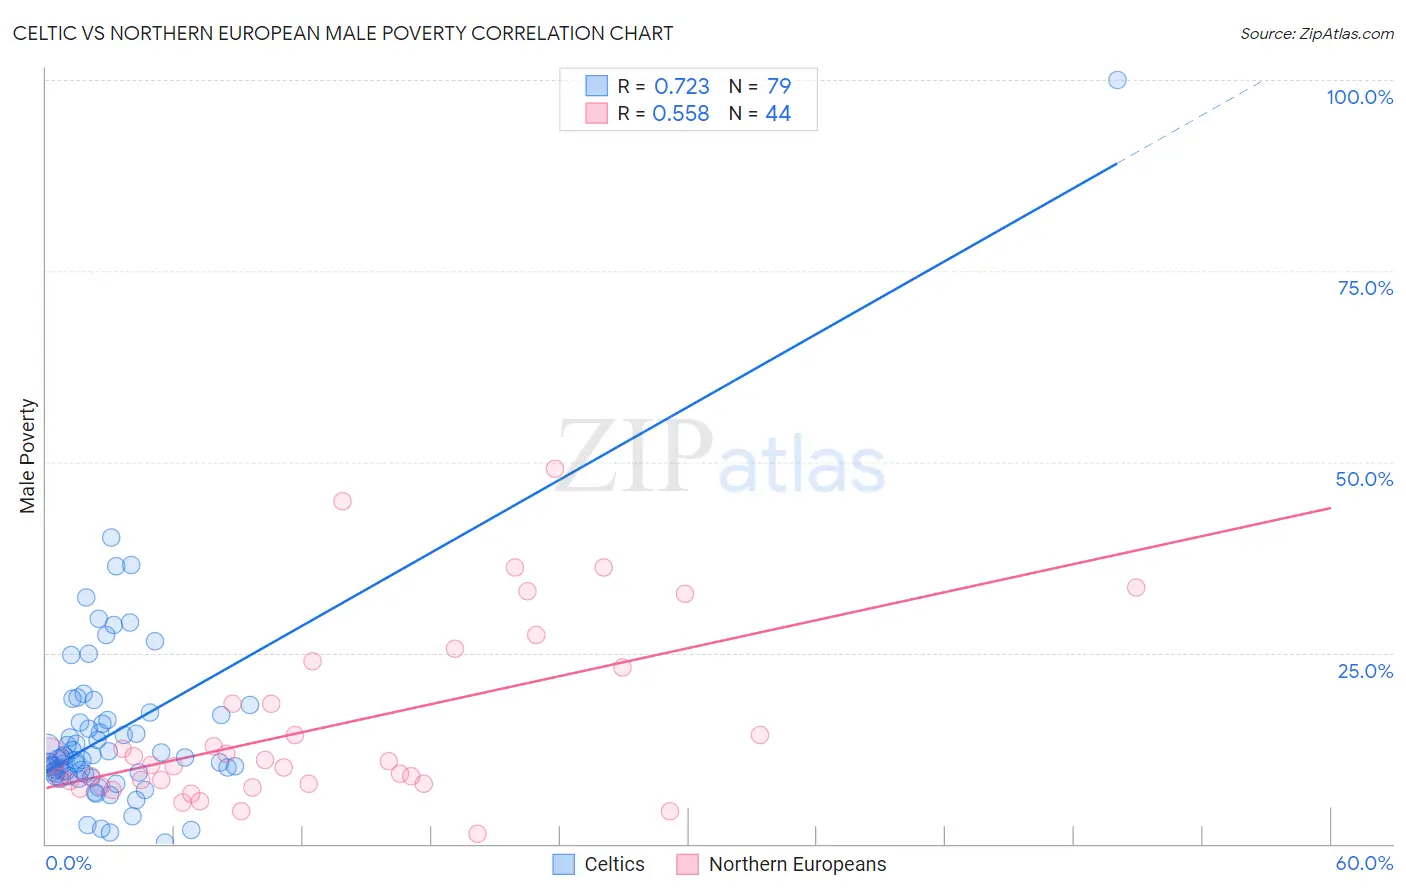
Celtic vs Northern European Male Poverty Correlation Chart
The statistical analysis conducted on geographies consisting of 168,829,630 people shows a strong positive correlation between the proportion of Celtics and poverty level among males in the United States with a correlation coefficient (R) of 0.723 and weighted average of 11.2%. Similarly, the statistical analysis conducted on geographies consisting of 405,718,489 people shows a substantial positive correlation between the proportion of Northern Europeans and poverty level among males in the United States with a correlation coefficient (R) of 0.558 and weighted average of 10.4%, a difference of 8.2%.
Male Poverty Correlation Summary
| Measurement | Celtic | Northern European |
| Minimum | 0.22% | 1.2% |
| Maximum | 100.0% | 49.1% |
| Range | 99.8% | 47.9% |
| Mean | 14.6% | 15.3% |
| Median | 11.2% | 10.6% |
| Interquartile 25% (IQ1) | 9.2% | 7.9% |
| Interquartile 75% (IQ3) | 16.2% | 20.7% |
| Interquartile Range (IQR) | 6.9% | 12.9% |
| Standard Deviation (Sample) | 12.7% | 11.6% |
| Standard Deviation (Population) | 12.6% | 11.5% |
Similar Demographics by Male Poverty
Demographics Similar to Celtics by Male Poverty
In terms of male poverty, the demographic groups most similar to Celtics are Immigrants from Fiji (11.2%, a difference of 0.14%), Lebanese (11.2%, a difference of 0.18%), Immigrants from Oceania (11.2%, a difference of 0.25%), Pennsylvania German (11.2%, a difference of 0.29%), and Immigrants from Cameroon (11.2%, a difference of 0.29%).
| Demographics | Rating | Rank | Male Poverty |
| Immigrants | Portugal | 54.9 /100 | #168 | Average 11.1% |
| Immigrants | Colombia | 54.2 /100 | #169 | Average 11.1% |
| South Americans | 53.8 /100 | #170 | Average 11.1% |
| Uruguayans | 51.0 /100 | #171 | Average 11.2% |
| Immigrants | Ethiopia | 50.7 /100 | #172 | Average 11.2% |
| Pennsylvania Germans | 50.5 /100 | #173 | Average 11.2% |
| Immigrants | Oceania | 50.0 /100 | #174 | Average 11.2% |
| Celtics | 47.5 /100 | #175 | Average 11.2% |
| Immigrants | Fiji | 46.0 /100 | #176 | Average 11.2% |
| Lebanese | 45.6 /100 | #177 | Average 11.2% |
| Immigrants | Cameroon | 44.5 /100 | #178 | Average 11.2% |
| Immigrants | Syria | 40.3 /100 | #179 | Average 11.3% |
| Immigrants | Morocco | 40.1 /100 | #180 | Average 11.3% |
| Immigrants | Costa Rica | 39.5 /100 | #181 | Fair 11.3% |
| Mongolians | 39.0 /100 | #182 | Fair 11.3% |
Demographics Similar to Northern Europeans by Male Poverty
In terms of male poverty, the demographic groups most similar to Northern Europeans are Immigrants from Eastern Asia (10.4%, a difference of 0.040%), Cambodian (10.4%, a difference of 0.14%), Immigrants from Denmark (10.4%, a difference of 0.14%), Immigrants from England (10.4%, a difference of 0.17%), and Indian (Asian) (10.4%, a difference of 0.17%).
| Demographics | Rating | Rank | Male Poverty |
| English | 96.4 /100 | #80 | Exceptional 10.3% |
| Belgians | 95.9 /100 | #81 | Exceptional 10.3% |
| Egyptians | 95.9 /100 | #82 | Exceptional 10.3% |
| Immigrants | Sweden | 95.7 /100 | #83 | Exceptional 10.3% |
| Czechoslovakians | 95.6 /100 | #84 | Exceptional 10.3% |
| Immigrants | England | 95.5 /100 | #85 | Exceptional 10.4% |
| Immigrants | Eastern Asia | 95.3 /100 | #86 | Exceptional 10.4% |
| Northern Europeans | 95.2 /100 | #87 | Exceptional 10.4% |
| Cambodians | 95.0 /100 | #88 | Exceptional 10.4% |
| Immigrants | Denmark | 95.0 /100 | #89 | Exceptional 10.4% |
| Indians (Asian) | 94.9 /100 | #90 | Exceptional 10.4% |
| British | 94.8 /100 | #91 | Exceptional 10.4% |
| Jordanians | 94.4 /100 | #92 | Exceptional 10.4% |
| Australians | 94.4 /100 | #93 | Exceptional 10.4% |
| Immigrants | South Africa | 94.1 /100 | #94 | Exceptional 10.4% |