Celtic vs Immigrants from Russia Male Poverty
COMPARE
Celtic
Immigrants from Russia
Male Poverty
Male Poverty Comparison
Celtics
Immigrants from Russia
11.2%
MALE POVERTY
47.5/ 100
METRIC RATING
175th/ 347
METRIC RANK
10.6%
MALE POVERTY
88.6/ 100
METRIC RATING
115th/ 347
METRIC RANK
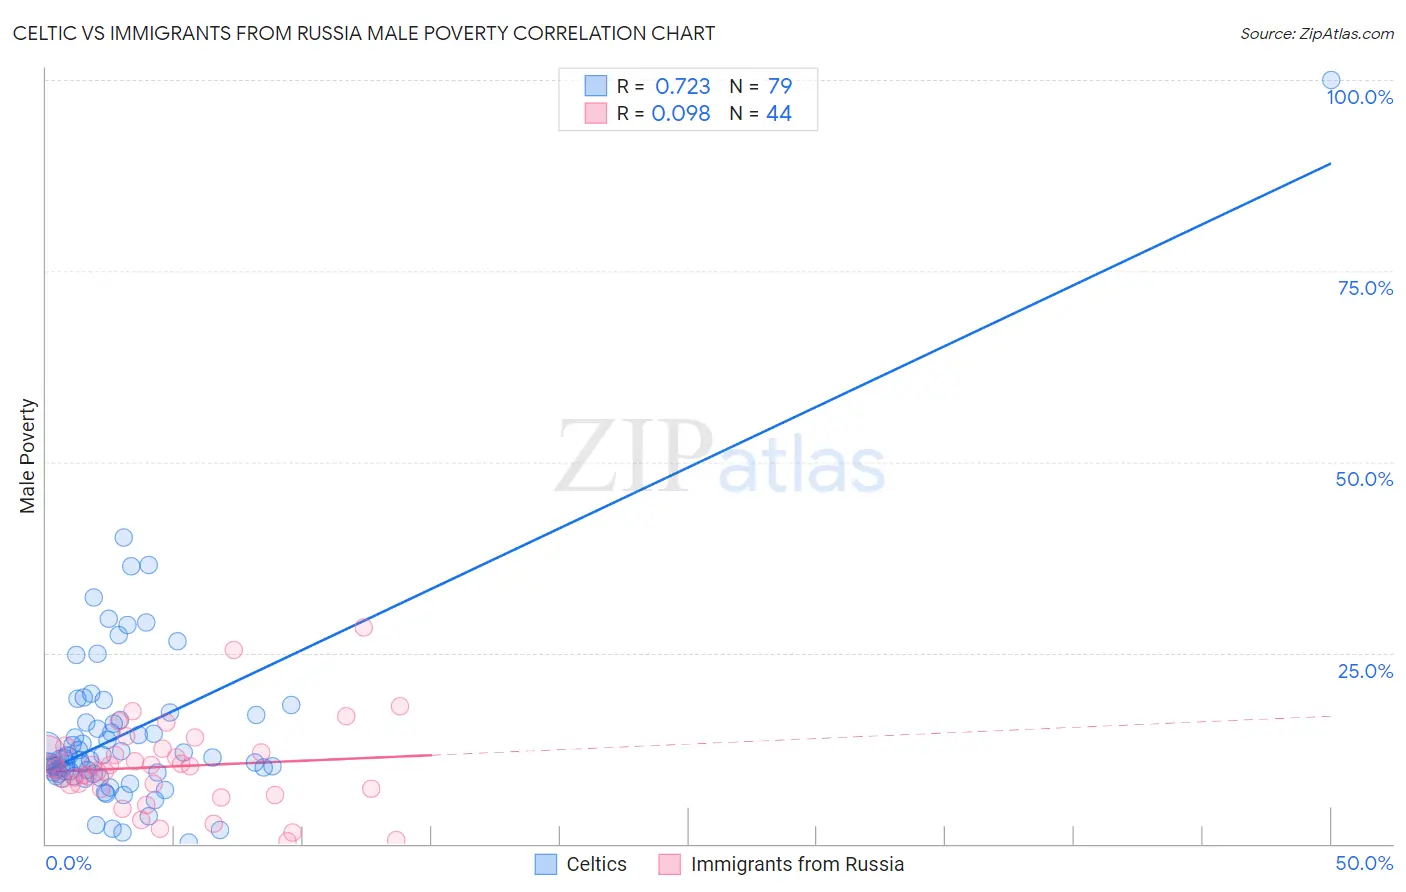
Celtic vs Immigrants from Russia Male Poverty Correlation Chart
The statistical analysis conducted on geographies consisting of 168,829,630 people shows a strong positive correlation between the proportion of Celtics and poverty level among males in the United States with a correlation coefficient (R) of 0.723 and weighted average of 11.2%. Similarly, the statistical analysis conducted on geographies consisting of 347,573,177 people shows a slight positive correlation between the proportion of Immigrants from Russia and poverty level among males in the United States with a correlation coefficient (R) of 0.098 and weighted average of 10.6%, a difference of 5.5%.
Male Poverty Correlation Summary
| Measurement | Celtic | Immigrants from Russia |
| Minimum | 0.22% | 0.34% |
| Maximum | 100.0% | 28.4% |
| Range | 99.8% | 28.0% |
| Mean | 14.6% | 10.1% |
| Median | 11.2% | 10.0% |
| Interquartile 25% (IQ1) | 9.2% | 7.2% |
| Interquartile 75% (IQ3) | 16.2% | 12.2% |
| Interquartile Range (IQR) | 6.9% | 5.0% |
| Standard Deviation (Sample) | 12.7% | 5.7% |
| Standard Deviation (Population) | 12.6% | 5.7% |
Similar Demographics by Male Poverty
Demographics Similar to Celtics by Male Poverty
In terms of male poverty, the demographic groups most similar to Celtics are Immigrants from Fiji (11.2%, a difference of 0.14%), Lebanese (11.2%, a difference of 0.18%), Immigrants from Oceania (11.2%, a difference of 0.25%), Pennsylvania German (11.2%, a difference of 0.29%), and Immigrants from Cameroon (11.2%, a difference of 0.29%).
| Demographics | Rating | Rank | Male Poverty |
| Immigrants | Portugal | 54.9 /100 | #168 | Average 11.1% |
| Immigrants | Colombia | 54.2 /100 | #169 | Average 11.1% |
| South Americans | 53.8 /100 | #170 | Average 11.1% |
| Uruguayans | 51.0 /100 | #171 | Average 11.2% |
| Immigrants | Ethiopia | 50.7 /100 | #172 | Average 11.2% |
| Pennsylvania Germans | 50.5 /100 | #173 | Average 11.2% |
| Immigrants | Oceania | 50.0 /100 | #174 | Average 11.2% |
| Celtics | 47.5 /100 | #175 | Average 11.2% |
| Immigrants | Fiji | 46.0 /100 | #176 | Average 11.2% |
| Lebanese | 45.6 /100 | #177 | Average 11.2% |
| Immigrants | Cameroon | 44.5 /100 | #178 | Average 11.2% |
| Immigrants | Syria | 40.3 /100 | #179 | Average 11.3% |
| Immigrants | Morocco | 40.1 /100 | #180 | Average 11.3% |
| Immigrants | Costa Rica | 39.5 /100 | #181 | Fair 11.3% |
| Mongolians | 39.0 /100 | #182 | Fair 11.3% |
Demographics Similar to Immigrants from Russia by Male Poverty
In terms of male poverty, the demographic groups most similar to Immigrants from Russia are Sri Lankan (10.6%, a difference of 0.11%), Immigrants from Brazil (10.6%, a difference of 0.12%), Immigrants from South Eastern Asia (10.6%, a difference of 0.13%), Palestinian (10.6%, a difference of 0.14%), and Immigrants from Turkey (10.6%, a difference of 0.24%).
| Demographics | Rating | Rank | Male Poverty |
| Portuguese | 91.0 /100 | #108 | Exceptional 10.6% |
| Albanians | 90.6 /100 | #109 | Exceptional 10.6% |
| Argentineans | 90.1 /100 | #110 | Exceptional 10.6% |
| Immigrants | Argentina | 89.8 /100 | #111 | Excellent 10.6% |
| Immigrants | Turkey | 89.5 /100 | #112 | Excellent 10.6% |
| Palestinians | 89.1 /100 | #113 | Excellent 10.6% |
| Immigrants | Brazil | 89.0 /100 | #114 | Excellent 10.6% |
| Immigrants | Russia | 88.6 /100 | #115 | Excellent 10.6% |
| Sri Lankans | 88.1 /100 | #116 | Excellent 10.6% |
| Immigrants | South Eastern Asia | 88.1 /100 | #117 | Excellent 10.6% |
| Okinawans | 87.6 /100 | #118 | Excellent 10.7% |
| Immigrants | Hungary | 87.6 /100 | #119 | Excellent 10.7% |
| Immigrants | China | 87.1 /100 | #120 | Excellent 10.7% |
| Peruvians | 87.1 /100 | #121 | Excellent 10.7% |
| Native Hawaiians | 87.0 /100 | #122 | Excellent 10.7% |