Comanche vs Lumbee Male Poverty
COMPARE
Comanche
Lumbee
Male Poverty
Male Poverty Comparison
Comanche
Lumbee
13.8%
MALE POVERTY
0.0/ 100
METRIC RATING
283rd/ 347
METRIC RANK
20.2%
MALE POVERTY
0.0/ 100
METRIC RATING
341st/ 347
METRIC RANK
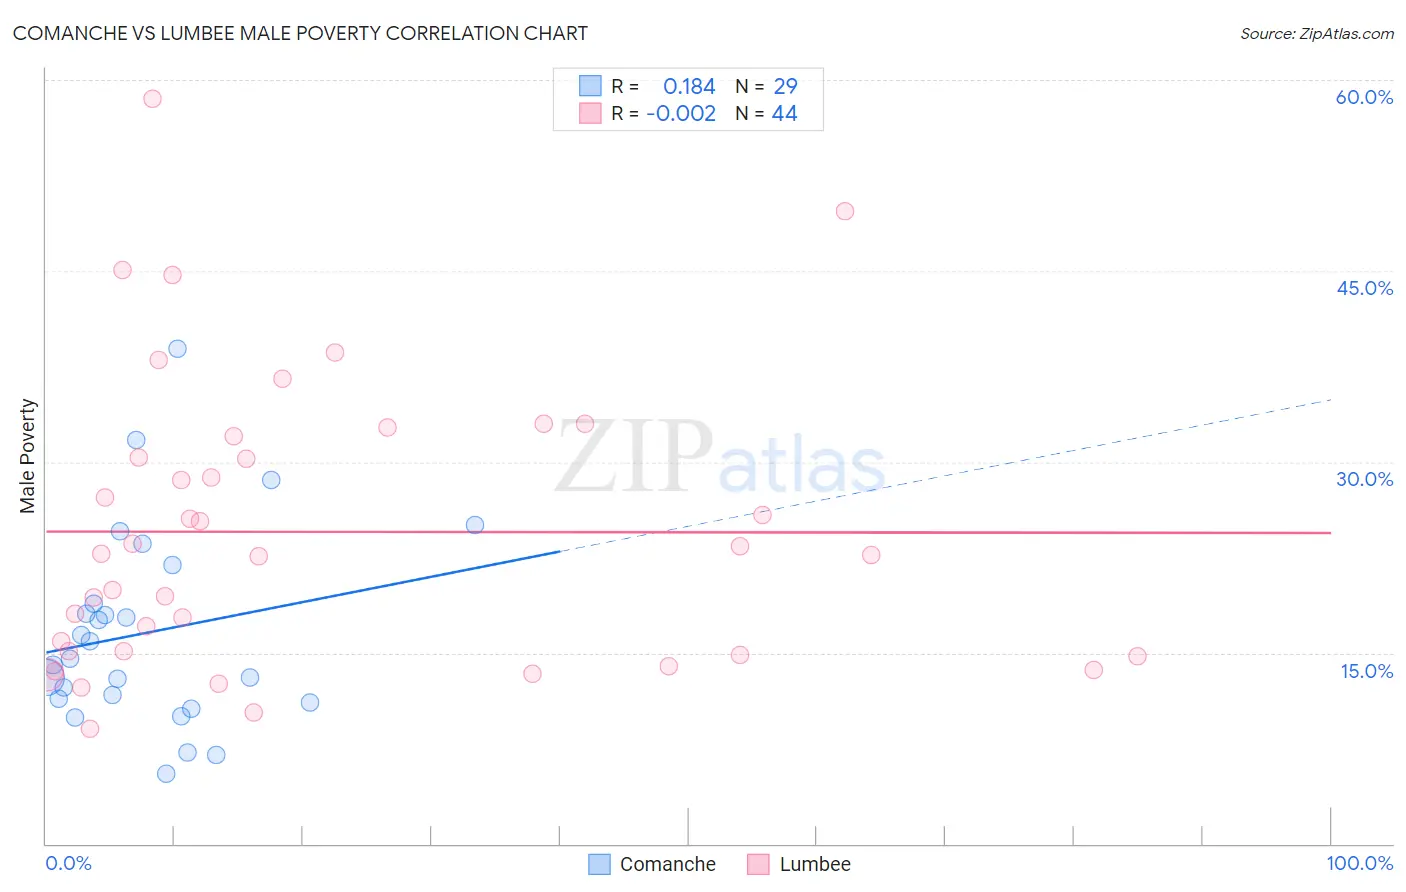
Comanche vs Lumbee Male Poverty Correlation Chart
The statistical analysis conducted on geographies consisting of 109,752,173 people shows a poor positive correlation between the proportion of Comanche and poverty level among males in the United States with a correlation coefficient (R) of 0.184 and weighted average of 13.8%. Similarly, the statistical analysis conducted on geographies consisting of 92,248,821 people shows no correlation between the proportion of Lumbee and poverty level among males in the United States with a correlation coefficient (R) of -0.002 and weighted average of 20.2%, a difference of 47.0%.
Male Poverty Correlation Summary
| Measurement | Comanche | Lumbee |
| Minimum | 5.5% | 9.1% |
| Maximum | 38.9% | 58.5% |
| Range | 33.4% | 49.5% |
| Mean | 16.6% | 24.5% |
| Median | 14.6% | 22.7% |
| Interquartile 25% (IQ1) | 11.2% | 15.0% |
| Interquartile 75% (IQ3) | 20.4% | 31.2% |
| Interquartile Range (IQR) | 9.2% | 16.2% |
| Standard Deviation (Sample) | 7.7% | 11.3% |
| Standard Deviation (Population) | 7.6% | 11.2% |
Similar Demographics by Male Poverty
Demographics Similar to Comanche by Male Poverty
In terms of male poverty, the demographic groups most similar to Comanche are Immigrants from Haiti (13.8%, a difference of 0.010%), West Indian (13.8%, a difference of 0.020%), Shoshone (13.8%, a difference of 0.050%), Immigrants from Barbados (13.8%, a difference of 0.070%), and Immigrants from Cabo Verde (13.7%, a difference of 0.20%).
| Demographics | Rating | Rank | Male Poverty |
| Immigrants | Latin America | 0.0 /100 | #276 | Tragic 13.6% |
| Bangladeshis | 0.0 /100 | #277 | Tragic 13.6% |
| Belizeans | 0.0 /100 | #278 | Tragic 13.6% |
| Haitians | 0.0 /100 | #279 | Tragic 13.7% |
| Mexicans | 0.0 /100 | #280 | Tragic 13.7% |
| Yaqui | 0.0 /100 | #281 | Tragic 13.7% |
| Immigrants | Cabo Verde | 0.0 /100 | #282 | Tragic 13.7% |
| Comanche | 0.0 /100 | #283 | Tragic 13.8% |
| Immigrants | Haiti | 0.0 /100 | #284 | Tragic 13.8% |
| West Indians | 0.0 /100 | #285 | Tragic 13.8% |
| Shoshone | 0.0 /100 | #286 | Tragic 13.8% |
| Immigrants | Barbados | 0.0 /100 | #287 | Tragic 13.8% |
| Immigrants | St. Vincent and the Grenadines | 0.0 /100 | #288 | Tragic 13.8% |
| Guatemalans | 0.0 /100 | #289 | Tragic 13.8% |
| Immigrants | Zaire | 0.0 /100 | #290 | Tragic 13.8% |
Demographics Similar to Lumbee by Male Poverty
In terms of male poverty, the demographic groups most similar to Lumbee are Immigrants from Yemen (20.1%, a difference of 0.30%), Pima (20.4%, a difference of 0.78%), Yup'ik (20.4%, a difference of 0.88%), Hopi (20.8%, a difference of 3.0%), and Yuman (19.5%, a difference of 3.4%).
| Demographics | Rating | Rank | Male Poverty |
| Natives/Alaskans | 0.0 /100 | #333 | Tragic 16.9% |
| Cheyenne | 0.0 /100 | #334 | Tragic 17.6% |
| Apache | 0.0 /100 | #335 | Tragic 17.7% |
| Pueblo | 0.0 /100 | #336 | Tragic 18.5% |
| Sioux | 0.0 /100 | #337 | Tragic 18.7% |
| Crow | 0.0 /100 | #338 | Tragic 19.1% |
| Yuman | 0.0 /100 | #339 | Tragic 19.5% |
| Immigrants | Yemen | 0.0 /100 | #340 | Tragic 20.1% |
| Lumbee | 0.0 /100 | #341 | Tragic 20.2% |
| Pima | 0.0 /100 | #342 | Tragic 20.4% |
| Yup'ik | 0.0 /100 | #343 | Tragic 20.4% |
| Hopi | 0.0 /100 | #344 | Tragic 20.8% |
| Puerto Ricans | 0.0 /100 | #345 | Tragic 22.0% |
| Navajo | 0.0 /100 | #346 | Tragic 22.3% |
| Tohono O'odham | 0.0 /100 | #347 | Tragic 22.9% |