Celtic vs Immigrants from South Eastern Asia Male Poverty
COMPARE
Celtic
Immigrants from South Eastern Asia
Male Poverty
Male Poverty Comparison
Celtics
Immigrants from South Eastern Asia
11.2%
MALE POVERTY
47.5/ 100
METRIC RATING
175th/ 347
METRIC RANK
10.6%
MALE POVERTY
88.1/ 100
METRIC RATING
117th/ 347
METRIC RANK
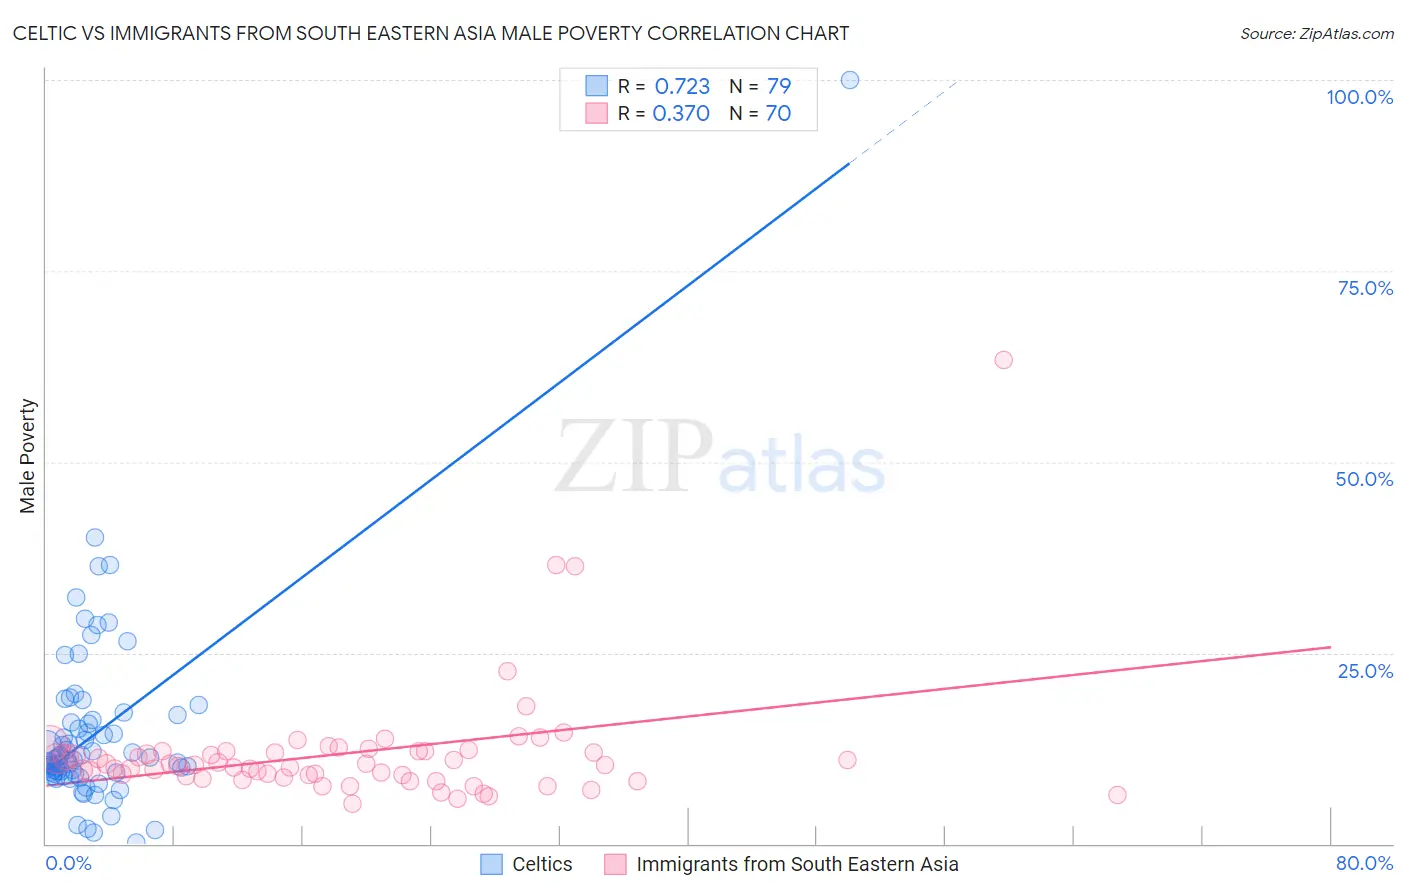
Celtic vs Immigrants from South Eastern Asia Male Poverty Correlation Chart
The statistical analysis conducted on geographies consisting of 168,829,630 people shows a strong positive correlation between the proportion of Celtics and poverty level among males in the United States with a correlation coefficient (R) of 0.723 and weighted average of 11.2%. Similarly, the statistical analysis conducted on geographies consisting of 511,932,643 people shows a mild positive correlation between the proportion of Immigrants from South Eastern Asia and poverty level among males in the United States with a correlation coefficient (R) of 0.370 and weighted average of 10.6%, a difference of 5.4%.
Male Poverty Correlation Summary
| Measurement | Celtic | Immigrants from South Eastern Asia |
| Minimum | 0.22% | 5.2% |
| Maximum | 100.0% | 63.3% |
| Range | 99.8% | 58.1% |
| Mean | 14.6% | 11.9% |
| Median | 11.2% | 10.3% |
| Interquartile 25% (IQ1) | 9.2% | 8.9% |
| Interquartile 75% (IQ3) | 16.2% | 12.1% |
| Interquartile Range (IQR) | 6.9% | 3.2% |
| Standard Deviation (Sample) | 12.7% | 8.1% |
| Standard Deviation (Population) | 12.6% | 8.0% |
Similar Demographics by Male Poverty
Demographics Similar to Celtics by Male Poverty
In terms of male poverty, the demographic groups most similar to Celtics are Immigrants from Fiji (11.2%, a difference of 0.14%), Lebanese (11.2%, a difference of 0.18%), Immigrants from Oceania (11.2%, a difference of 0.25%), Pennsylvania German (11.2%, a difference of 0.29%), and Immigrants from Cameroon (11.2%, a difference of 0.29%).
| Demographics | Rating | Rank | Male Poverty |
| Immigrants | Portugal | 54.9 /100 | #168 | Average 11.1% |
| Immigrants | Colombia | 54.2 /100 | #169 | Average 11.1% |
| South Americans | 53.8 /100 | #170 | Average 11.1% |
| Uruguayans | 51.0 /100 | #171 | Average 11.2% |
| Immigrants | Ethiopia | 50.7 /100 | #172 | Average 11.2% |
| Pennsylvania Germans | 50.5 /100 | #173 | Average 11.2% |
| Immigrants | Oceania | 50.0 /100 | #174 | Average 11.2% |
| Celtics | 47.5 /100 | #175 | Average 11.2% |
| Immigrants | Fiji | 46.0 /100 | #176 | Average 11.2% |
| Lebanese | 45.6 /100 | #177 | Average 11.2% |
| Immigrants | Cameroon | 44.5 /100 | #178 | Average 11.2% |
| Immigrants | Syria | 40.3 /100 | #179 | Average 11.3% |
| Immigrants | Morocco | 40.1 /100 | #180 | Average 11.3% |
| Immigrants | Costa Rica | 39.5 /100 | #181 | Fair 11.3% |
| Mongolians | 39.0 /100 | #182 | Fair 11.3% |
Demographics Similar to Immigrants from South Eastern Asia by Male Poverty
In terms of male poverty, the demographic groups most similar to Immigrants from South Eastern Asia are Sri Lankan (10.6%, a difference of 0.010%), Okinawan (10.7%, a difference of 0.11%), Immigrants from Hungary (10.7%, a difference of 0.12%), Immigrants from Russia (10.6%, a difference of 0.13%), and Immigrants from China (10.7%, a difference of 0.22%).
| Demographics | Rating | Rank | Male Poverty |
| Argentineans | 90.1 /100 | #110 | Exceptional 10.6% |
| Immigrants | Argentina | 89.8 /100 | #111 | Excellent 10.6% |
| Immigrants | Turkey | 89.5 /100 | #112 | Excellent 10.6% |
| Palestinians | 89.1 /100 | #113 | Excellent 10.6% |
| Immigrants | Brazil | 89.0 /100 | #114 | Excellent 10.6% |
| Immigrants | Russia | 88.6 /100 | #115 | Excellent 10.6% |
| Sri Lankans | 88.1 /100 | #116 | Excellent 10.6% |
| Immigrants | South Eastern Asia | 88.1 /100 | #117 | Excellent 10.6% |
| Okinawans | 87.6 /100 | #118 | Excellent 10.7% |
| Immigrants | Hungary | 87.6 /100 | #119 | Excellent 10.7% |
| Immigrants | China | 87.1 /100 | #120 | Excellent 10.7% |
| Peruvians | 87.1 /100 | #121 | Excellent 10.7% |
| Native Hawaiians | 87.0 /100 | #122 | Excellent 10.7% |
| South Africans | 86.8 /100 | #123 | Excellent 10.7% |
| French | 86.7 /100 | #124 | Excellent 10.7% |