Celtic vs Immigrants from Netherlands Male Poverty
COMPARE
Celtic
Immigrants from Netherlands
Male Poverty
Male Poverty Comparison
Celtics
Immigrants from Netherlands
11.2%
MALE POVERTY
47.5/ 100
METRIC RATING
175th/ 347
METRIC RANK
10.2%
MALE POVERTY
97.3/ 100
METRIC RATING
67th/ 347
METRIC RANK
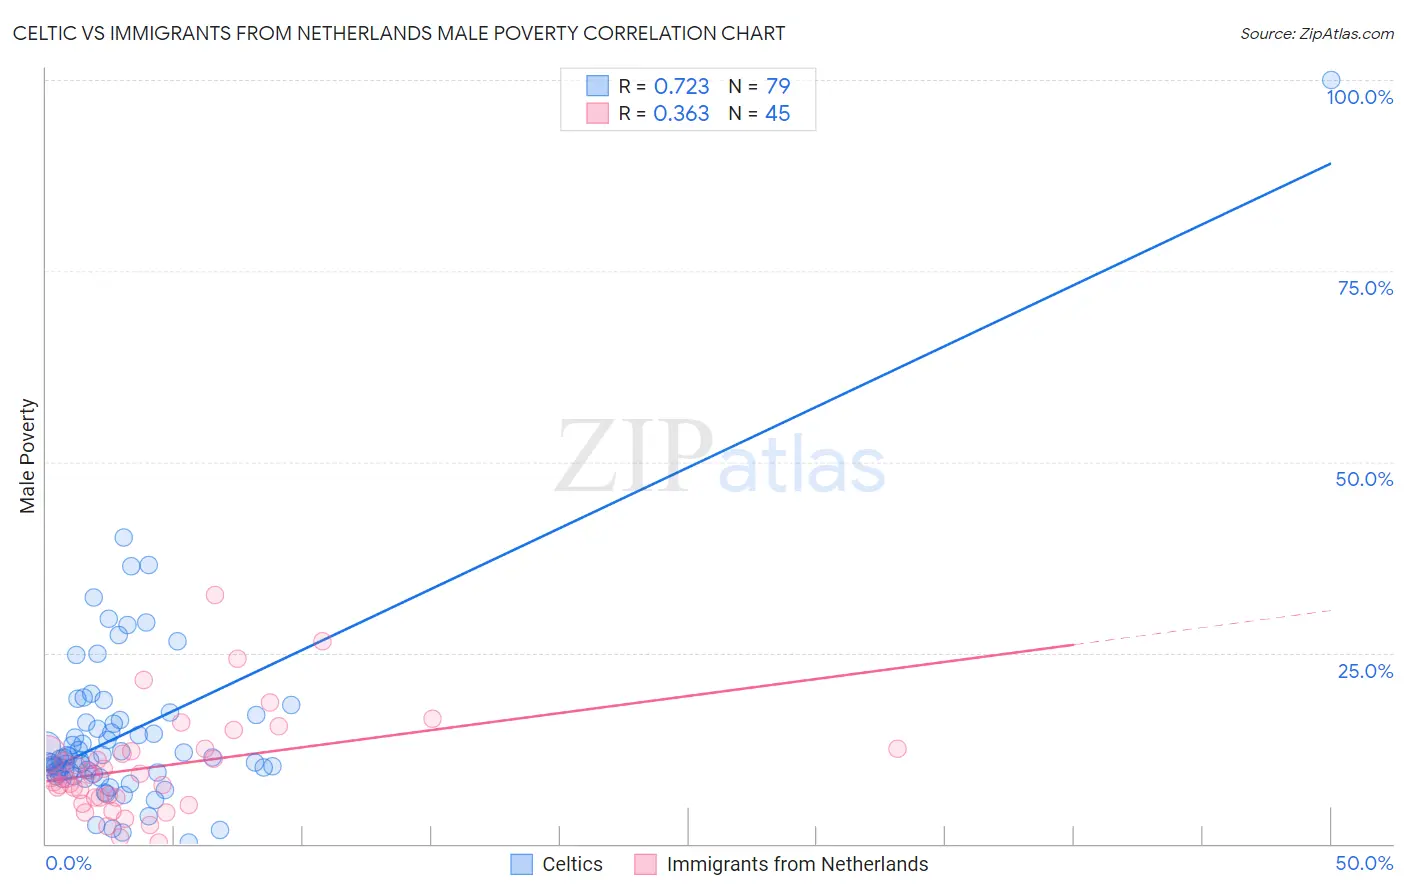
Celtic vs Immigrants from Netherlands Male Poverty Correlation Chart
The statistical analysis conducted on geographies consisting of 168,829,630 people shows a strong positive correlation between the proportion of Celtics and poverty level among males in the United States with a correlation coefficient (R) of 0.723 and weighted average of 11.2%. Similarly, the statistical analysis conducted on geographies consisting of 237,754,800 people shows a mild positive correlation between the proportion of Immigrants from Netherlands and poverty level among males in the United States with a correlation coefficient (R) of 0.363 and weighted average of 10.2%, a difference of 9.9%.
Male Poverty Correlation Summary
| Measurement | Celtic | Immigrants from Netherlands |
| Minimum | 0.22% | 0.21% |
| Maximum | 100.0% | 32.5% |
| Range | 99.8% | 32.3% |
| Mean | 14.6% | 10.1% |
| Median | 11.2% | 8.7% |
| Interquartile 25% (IQ1) | 9.2% | 6.0% |
| Interquartile 75% (IQ3) | 16.2% | 12.3% |
| Interquartile Range (IQR) | 6.9% | 6.3% |
| Standard Deviation (Sample) | 12.7% | 6.6% |
| Standard Deviation (Population) | 12.6% | 6.6% |
Similar Demographics by Male Poverty
Demographics Similar to Celtics by Male Poverty
In terms of male poverty, the demographic groups most similar to Celtics are Immigrants from Fiji (11.2%, a difference of 0.14%), Lebanese (11.2%, a difference of 0.18%), Immigrants from Oceania (11.2%, a difference of 0.25%), Pennsylvania German (11.2%, a difference of 0.29%), and Immigrants from Cameroon (11.2%, a difference of 0.29%).
| Demographics | Rating | Rank | Male Poverty |
| Immigrants | Portugal | 54.9 /100 | #168 | Average 11.1% |
| Immigrants | Colombia | 54.2 /100 | #169 | Average 11.1% |
| South Americans | 53.8 /100 | #170 | Average 11.1% |
| Uruguayans | 51.0 /100 | #171 | Average 11.2% |
| Immigrants | Ethiopia | 50.7 /100 | #172 | Average 11.2% |
| Pennsylvania Germans | 50.5 /100 | #173 | Average 11.2% |
| Immigrants | Oceania | 50.0 /100 | #174 | Average 11.2% |
| Celtics | 47.5 /100 | #175 | Average 11.2% |
| Immigrants | Fiji | 46.0 /100 | #176 | Average 11.2% |
| Lebanese | 45.6 /100 | #177 | Average 11.2% |
| Immigrants | Cameroon | 44.5 /100 | #178 | Average 11.2% |
| Immigrants | Syria | 40.3 /100 | #179 | Average 11.3% |
| Immigrants | Morocco | 40.1 /100 | #180 | Average 11.3% |
| Immigrants | Costa Rica | 39.5 /100 | #181 | Fair 11.3% |
| Mongolians | 39.0 /100 | #182 | Fair 11.3% |
Demographics Similar to Immigrants from Netherlands by Male Poverty
In terms of male poverty, the demographic groups most similar to Immigrants from Netherlands are Immigrants from Sri Lanka (10.2%, a difference of 0.050%), Serbian (10.2%, a difference of 0.17%), Zimbabwean (10.2%, a difference of 0.18%), Immigrants from Australia (10.2%, a difference of 0.18%), and Paraguayan (10.2%, a difference of 0.20%).
| Demographics | Rating | Rank | Male Poverty |
| Ukrainians | 97.9 /100 | #60 | Exceptional 10.1% |
| Austrians | 97.8 /100 | #61 | Exceptional 10.1% |
| Immigrants | Italy | 97.8 /100 | #62 | Exceptional 10.2% |
| Slovaks | 97.7 /100 | #63 | Exceptional 10.2% |
| Swiss | 97.5 /100 | #64 | Exceptional 10.2% |
| Zimbabweans | 97.5 /100 | #65 | Exceptional 10.2% |
| Serbians | 97.5 /100 | #66 | Exceptional 10.2% |
| Immigrants | Netherlands | 97.3 /100 | #67 | Exceptional 10.2% |
| Immigrants | Sri Lanka | 97.2 /100 | #68 | Exceptional 10.2% |
| Immigrants | Australia | 97.1 /100 | #69 | Exceptional 10.2% |
| Paraguayans | 97.1 /100 | #70 | Exceptional 10.2% |
| Europeans | 97.1 /100 | #71 | Exceptional 10.2% |
| Immigrants | Canada | 97.1 /100 | #72 | Exceptional 10.2% |
| Immigrants | Asia | 97.0 /100 | #73 | Exceptional 10.2% |
| Immigrants | Eastern Europe | 96.9 /100 | #74 | Exceptional 10.2% |