Celtic vs Immigrants from Morocco Unemployment Among Ages 60 to 64 years
COMPARE
Celtic
Immigrants from Morocco
Unemployment Among Ages 60 to 64 years
Unemployment Among Ages 60 to 64 years Comparison
Celtics
Immigrants from Morocco
5.1%
UNEMPLOYMENT AMONG AGES 60 TO 64 YEARS
0.5/ 100
METRIC RATING
258th/ 347
METRIC RANK
4.7%
UNEMPLOYMENT AMONG AGES 60 TO 64 YEARS
95.7/ 100
METRIC RATING
119th/ 347
METRIC RANK
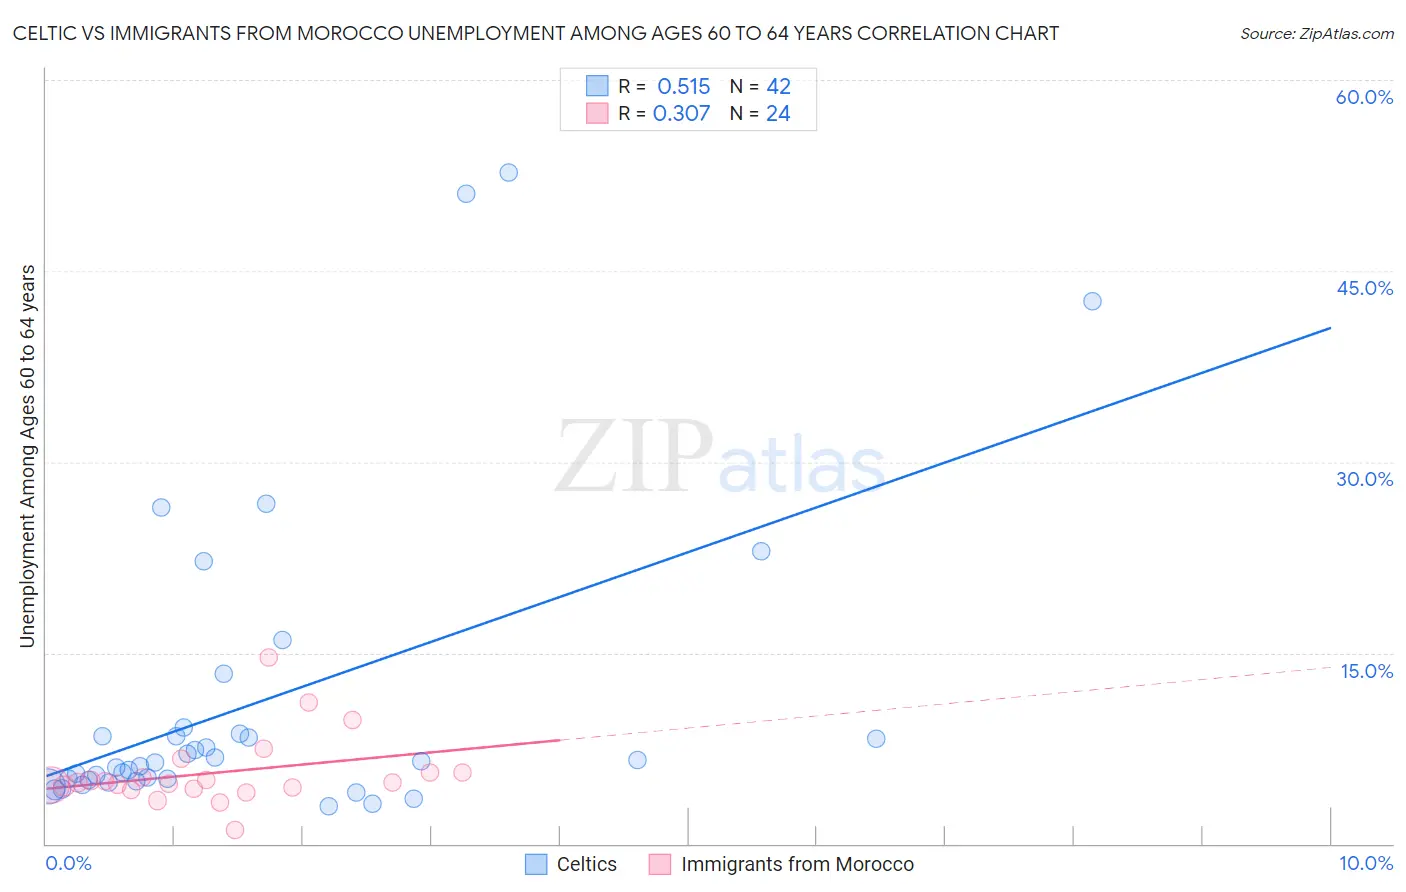
Celtic vs Immigrants from Morocco Unemployment Among Ages 60 to 64 years Correlation Chart
The statistical analysis conducted on geographies consisting of 159,043,425 people shows a substantial positive correlation between the proportion of Celtics and unemployment rate among population between the ages 60 and 64 in the United States with a correlation coefficient (R) of 0.515 and weighted average of 5.1%. Similarly, the statistical analysis conducted on geographies consisting of 172,914,481 people shows a mild positive correlation between the proportion of Immigrants from Morocco and unemployment rate among population between the ages 60 and 64 in the United States with a correlation coefficient (R) of 0.307 and weighted average of 4.7%, a difference of 7.6%.
Unemployment Among Ages 60 to 64 years Correlation Summary
| Measurement | Celtic | Immigrants from Morocco |
| Minimum | 2.9% | 1.1% |
| Maximum | 52.7% | 14.7% |
| Range | 49.8% | 13.6% |
| Mean | 11.2% | 5.6% |
| Median | 6.4% | 4.8% |
| Interquartile 25% (IQ1) | 5.0% | 4.3% |
| Interquartile 75% (IQ3) | 8.7% | 5.6% |
| Interquartile Range (IQR) | 3.7% | 1.3% |
| Standard Deviation (Sample) | 12.2% | 2.8% |
| Standard Deviation (Population) | 12.0% | 2.7% |
Similar Demographics by Unemployment Among Ages 60 to 64 years
Demographics Similar to Celtics by Unemployment Among Ages 60 to 64 years
In terms of unemployment among ages 60 to 64 years, the demographic groups most similar to Celtics are Honduran (5.1%, a difference of 0.010%), Immigrants from Honduras (5.1%, a difference of 0.14%), Japanese (5.1%, a difference of 0.16%), Immigrants from Ghana (5.1%, a difference of 0.23%), and Immigrants from Uzbekistan (5.1%, a difference of 0.26%).
| Demographics | Rating | Rank | Unemployment Among Ages 60 to 64 years |
| Immigrants | Uruguay | 0.9 /100 | #251 | Tragic 5.1% |
| Immigrants | Switzerland | 0.9 /100 | #252 | Tragic 5.1% |
| Immigrants | China | 0.9 /100 | #253 | Tragic 5.1% |
| Costa Ricans | 0.8 /100 | #254 | Tragic 5.1% |
| Estonians | 0.8 /100 | #255 | Tragic 5.1% |
| Immigrants | Peru | 0.7 /100 | #256 | Tragic 5.1% |
| Japanese | 0.6 /100 | #257 | Tragic 5.1% |
| Celtics | 0.5 /100 | #258 | Tragic 5.1% |
| Hondurans | 0.5 /100 | #259 | Tragic 5.1% |
| Immigrants | Honduras | 0.4 /100 | #260 | Tragic 5.1% |
| Immigrants | Ghana | 0.4 /100 | #261 | Tragic 5.1% |
| Immigrants | Uzbekistan | 0.4 /100 | #262 | Tragic 5.1% |
| Immigrants | Immigrants | 0.4 /100 | #263 | Tragic 5.1% |
| Sioux | 0.3 /100 | #264 | Tragic 5.1% |
| Immigrants | Argentina | 0.2 /100 | #265 | Tragic 5.1% |
Demographics Similar to Immigrants from Morocco by Unemployment Among Ages 60 to 64 years
In terms of unemployment among ages 60 to 64 years, the demographic groups most similar to Immigrants from Morocco are Macedonian (4.7%, a difference of 0.010%), Ukrainian (4.7%, a difference of 0.090%), Albanian (4.7%, a difference of 0.090%), Immigrants from Kazakhstan (4.7%, a difference of 0.12%), and Immigrants from England (4.7%, a difference of 0.14%).
| Demographics | Rating | Rank | Unemployment Among Ages 60 to 64 years |
| Syrians | 97.0 /100 | #112 | Exceptional 4.7% |
| Bulgarians | 96.6 /100 | #113 | Exceptional 4.7% |
| Maltese | 96.5 /100 | #114 | Exceptional 4.7% |
| Immigrants | Romania | 96.4 /100 | #115 | Exceptional 4.7% |
| Immigrants | England | 96.3 /100 | #116 | Exceptional 4.7% |
| Immigrants | Germany | 96.3 /100 | #117 | Exceptional 4.7% |
| Ukrainians | 96.1 /100 | #118 | Exceptional 4.7% |
| Immigrants | Morocco | 95.7 /100 | #119 | Exceptional 4.7% |
| Macedonians | 95.7 /100 | #120 | Exceptional 4.7% |
| Albanians | 95.3 /100 | #121 | Exceptional 4.7% |
| Immigrants | Kazakhstan | 95.1 /100 | #122 | Exceptional 4.7% |
| Finns | 94.7 /100 | #123 | Exceptional 4.7% |
| Immigrants | Senegal | 94.5 /100 | #124 | Exceptional 4.7% |
| Immigrants | Thailand | 93.7 /100 | #125 | Exceptional 4.7% |
| Immigrants | South Central Asia | 93.0 /100 | #126 | Exceptional 4.7% |