Canadian vs Immigrants from Morocco Single Male Poverty
COMPARE
Canadian
Immigrants from Morocco
Single Male Poverty
Single Male Poverty Comparison
Canadians
Immigrants from Morocco
13.3%
SINGLE MALE POVERTY
4.0/ 100
METRIC RATING
234th/ 347
METRIC RANK
12.3%
SINGLE MALE POVERTY
95.6/ 100
METRIC RATING
106th/ 347
METRIC RANK
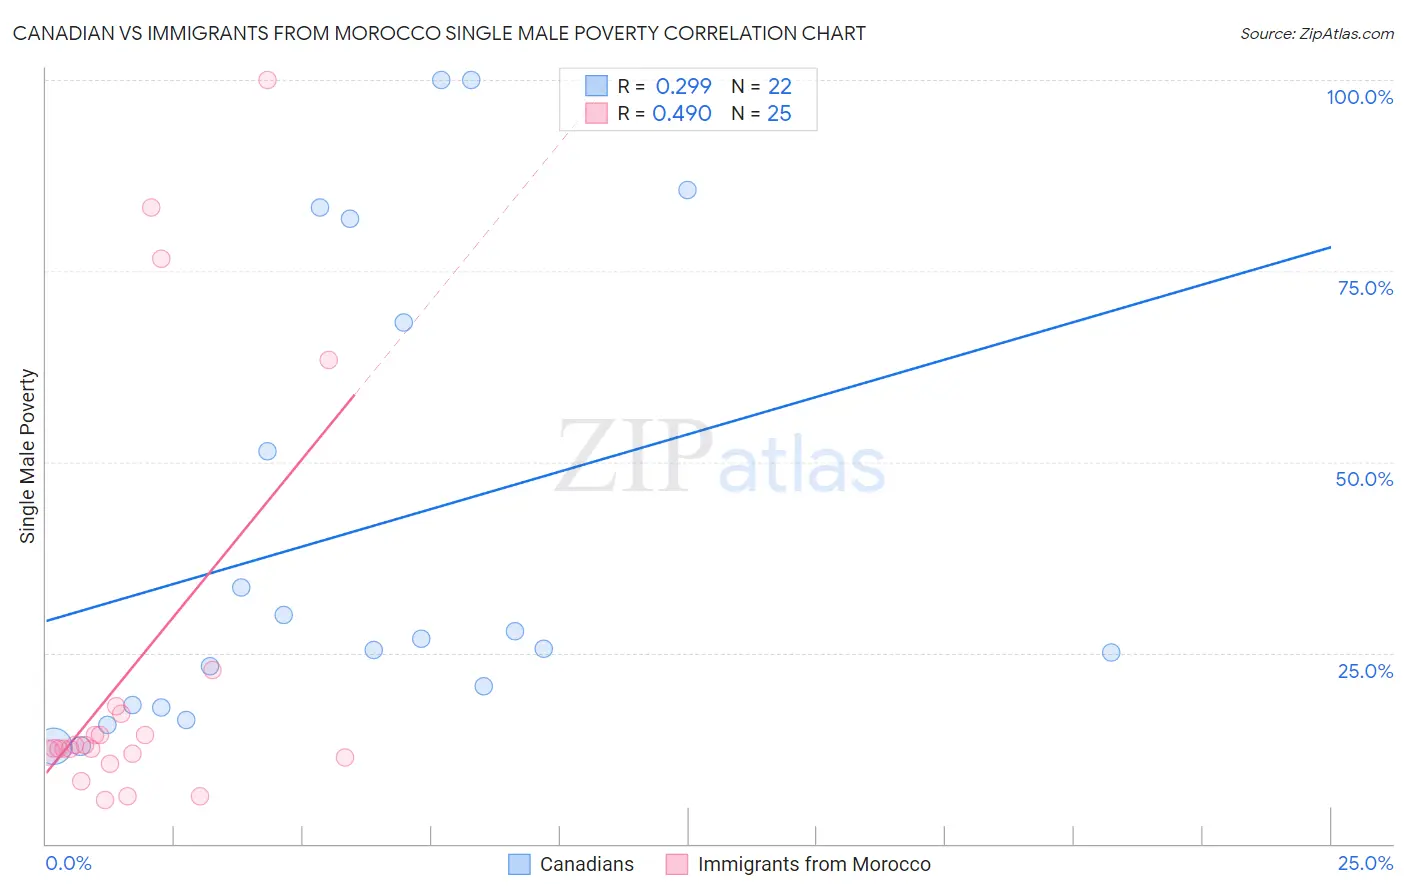
Canadian vs Immigrants from Morocco Single Male Poverty Correlation Chart
The statistical analysis conducted on geographies consisting of 379,144,992 people shows a weak positive correlation between the proportion of Canadians and poverty level among single males in the United States with a correlation coefficient (R) of 0.299 and weighted average of 13.3%. Similarly, the statistical analysis conducted on geographies consisting of 166,868,254 people shows a moderate positive correlation between the proportion of Immigrants from Morocco and poverty level among single males in the United States with a correlation coefficient (R) of 0.490 and weighted average of 12.3%, a difference of 8.6%.
Single Male Poverty Correlation Summary
| Measurement | Canadian | Immigrants from Morocco |
| Minimum | 12.8% | 5.8% |
| Maximum | 100.0% | 100.0% |
| Range | 87.2% | 94.2% |
| Mean | 41.0% | 23.3% |
| Median | 26.2% | 12.5% |
| Interquartile 25% (IQ1) | 18.1% | 11.5% |
| Interquartile 75% (IQ3) | 68.3% | 17.5% |
| Interquartile Range (IQR) | 50.1% | 5.9% |
| Standard Deviation (Sample) | 30.2% | 26.4% |
| Standard Deviation (Population) | 29.5% | 25.9% |
Similar Demographics by Single Male Poverty
Demographics Similar to Canadians by Single Male Poverty
In terms of single male poverty, the demographic groups most similar to Canadians are British (13.3%, a difference of 0.0%), Bangladeshi (13.3%, a difference of 0.10%), Luxembourger (13.4%, a difference of 0.15%), British West Indian (13.4%, a difference of 0.21%), and Immigrants from Caribbean (13.3%, a difference of 0.29%).
| Demographics | Rating | Rank | Single Male Poverty |
| Haitians | 7.0 /100 | #227 | Tragic 13.2% |
| Lebanese | 6.6 /100 | #228 | Tragic 13.2% |
| Europeans | 6.2 /100 | #229 | Tragic 13.3% |
| Ghanaians | 6.1 /100 | #230 | Tragic 13.3% |
| Slavs | 5.3 /100 | #231 | Tragic 13.3% |
| Immigrants | Caribbean | 5.0 /100 | #232 | Tragic 13.3% |
| British | 4.0 /100 | #233 | Tragic 13.3% |
| Canadians | 4.0 /100 | #234 | Tragic 13.3% |
| Bangladeshis | 3.7 /100 | #235 | Tragic 13.3% |
| Luxembourgers | 3.6 /100 | #236 | Tragic 13.4% |
| British West Indians | 3.4 /100 | #237 | Tragic 13.4% |
| Immigrants | Ghana | 3.2 /100 | #238 | Tragic 13.4% |
| Czechoslovakians | 3.0 /100 | #239 | Tragic 13.4% |
| Belizeans | 2.3 /100 | #240 | Tragic 13.4% |
| Immigrants | Germany | 2.1 /100 | #241 | Tragic 13.4% |
Demographics Similar to Immigrants from Morocco by Single Male Poverty
In terms of single male poverty, the demographic groups most similar to Immigrants from Morocco are Jordanian (12.3%, a difference of 0.080%), Iraqi (12.3%, a difference of 0.18%), Immigrants from Eastern Africa (12.3%, a difference of 0.20%), Ugandan (12.3%, a difference of 0.33%), and Immigrants from Armenia (12.2%, a difference of 0.40%).
| Demographics | Rating | Rank | Single Male Poverty |
| Immigrants | Cuba | 97.3 /100 | #99 | Exceptional 12.2% |
| Immigrants | Australia | 97.1 /100 | #100 | Exceptional 12.2% |
| Immigrants | Latvia | 97.0 /100 | #101 | Exceptional 12.2% |
| Immigrants | Europe | 97.0 /100 | #102 | Exceptional 12.2% |
| Immigrants | Armenia | 96.7 /100 | #103 | Exceptional 12.2% |
| Immigrants | Kazakhstan | 96.7 /100 | #104 | Exceptional 12.2% |
| Jordanians | 95.9 /100 | #105 | Exceptional 12.3% |
| Immigrants | Morocco | 95.6 /100 | #106 | Exceptional 12.3% |
| Iraqis | 95.1 /100 | #107 | Exceptional 12.3% |
| Immigrants | Eastern Africa | 95.0 /100 | #108 | Exceptional 12.3% |
| Ugandans | 94.5 /100 | #109 | Exceptional 12.3% |
| Immigrants | Portugal | 93.6 /100 | #110 | Exceptional 12.3% |
| Immigrants | North Macedonia | 93.6 /100 | #111 | Exceptional 12.3% |
| Kenyans | 93.3 /100 | #112 | Exceptional 12.4% |
| Pakistanis | 92.4 /100 | #113 | Exceptional 12.4% |