Celtic vs Immigrants from Morocco Doctorate Degree
COMPARE
Celtic
Immigrants from Morocco
Doctorate Degree
Doctorate Degree Comparison
Celtics
Immigrants from Morocco
1.9%
DOCTORATE DEGREE
66.7/ 100
METRIC RATING
164th/ 347
METRIC RANK
2.0%
DOCTORATE DEGREE
95.5/ 100
METRIC RATING
120th/ 347
METRIC RANK
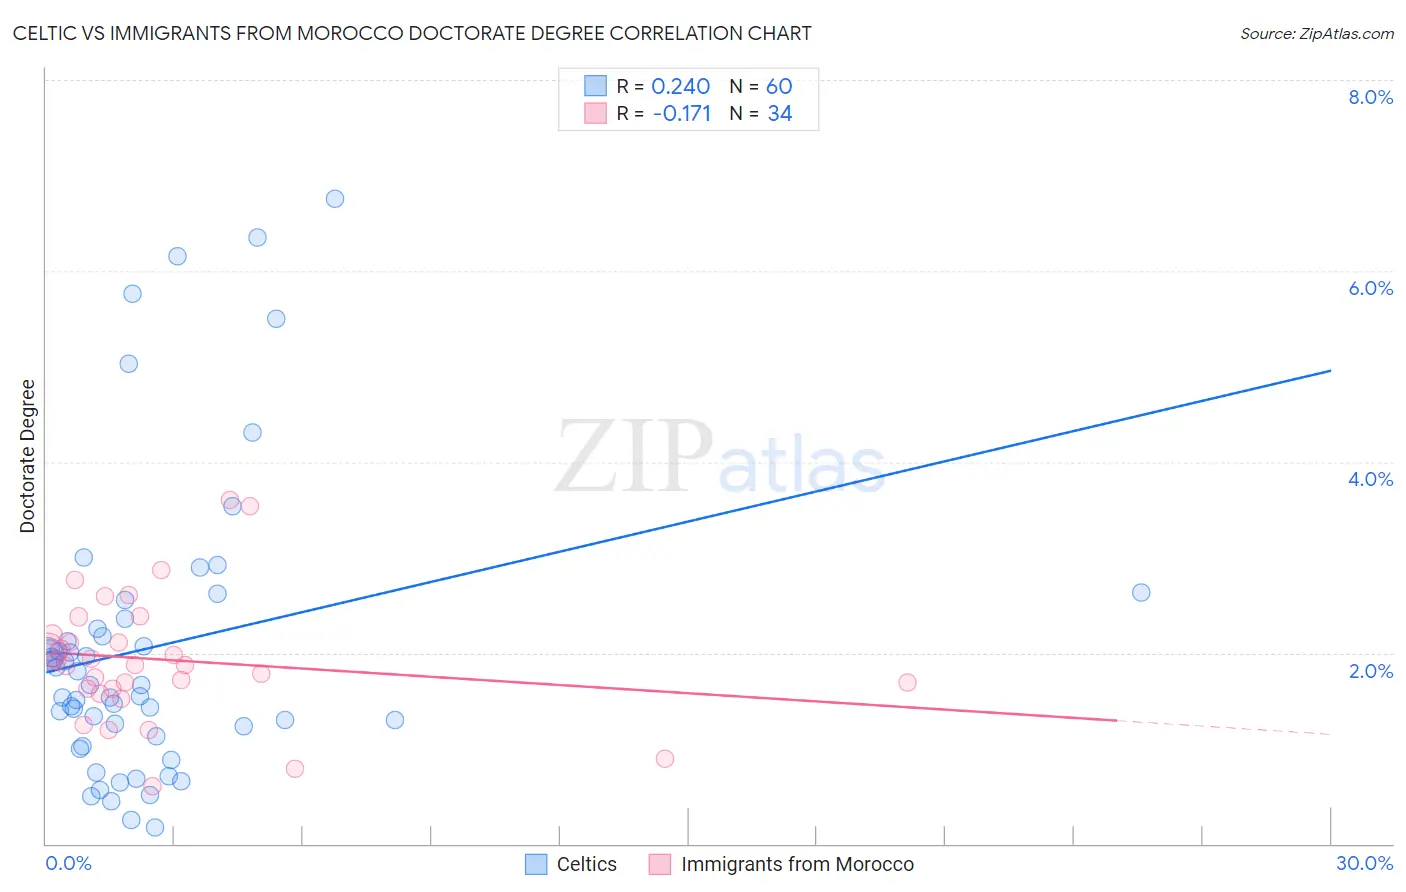
Celtic vs Immigrants from Morocco Doctorate Degree Correlation Chart
The statistical analysis conducted on geographies consisting of 167,913,023 people shows a weak positive correlation between the proportion of Celtics and percentage of population with at least doctorate degree education in the United States with a correlation coefficient (R) of 0.240 and weighted average of 1.9%. Similarly, the statistical analysis conducted on geographies consisting of 178,707,099 people shows a poor negative correlation between the proportion of Immigrants from Morocco and percentage of population with at least doctorate degree education in the United States with a correlation coefficient (R) of -0.171 and weighted average of 2.0%, a difference of 8.4%.
Doctorate Degree Correlation Summary
| Measurement | Celtic | Immigrants from Morocco |
| Minimum | 0.17% | 0.60% |
| Maximum | 6.8% | 3.6% |
| Range | 6.6% | 3.0% |
| Mean | 2.1% | 1.9% |
| Median | 1.7% | 1.9% |
| Interquartile 25% (IQ1) | 1.2% | 1.6% |
| Interquartile 75% (IQ3) | 2.3% | 2.2% |
| Interquartile Range (IQR) | 1.1% | 0.57% |
| Standard Deviation (Sample) | 1.5% | 0.67% |
| Standard Deviation (Population) | 1.5% | 0.66% |
Similar Demographics by Doctorate Degree
Demographics Similar to Celtics by Doctorate Degree
In terms of doctorate degree, the demographic groups most similar to Celtics are Czech (1.9%, a difference of 0.10%), Irish (1.9%, a difference of 0.13%), Immigrants from Middle Africa (1.9%, a difference of 0.35%), Scotch-Irish (1.9%, a difference of 0.49%), and Welsh (1.9%, a difference of 0.50%).
| Demographics | Rating | Rank | Doctorate Degree |
| Danes | 71.9 /100 | #157 | Good 1.9% |
| Hungarians | 71.7 /100 | #158 | Good 1.9% |
| Slovenes | 70.2 /100 | #159 | Good 1.9% |
| Welsh | 69.7 /100 | #160 | Good 1.9% |
| Immigrants | Middle Africa | 68.8 /100 | #161 | Good 1.9% |
| Irish | 67.5 /100 | #162 | Good 1.9% |
| Czechs | 67.3 /100 | #163 | Good 1.9% |
| Celtics | 66.7 /100 | #164 | Good 1.9% |
| Scotch-Irish | 63.6 /100 | #165 | Good 1.9% |
| Spaniards | 63.5 /100 | #166 | Good 1.9% |
| Macedonians | 60.9 /100 | #167 | Good 1.9% |
| Sri Lankans | 60.3 /100 | #168 | Good 1.9% |
| Vietnamese | 54.8 /100 | #169 | Average 1.9% |
| Costa Ricans | 53.3 /100 | #170 | Average 1.8% |
| Bermudans | 52.1 /100 | #171 | Average 1.8% |
Demographics Similar to Immigrants from Morocco by Doctorate Degree
In terms of doctorate degree, the demographic groups most similar to Immigrants from Morocco are Pakistani (2.0%, a difference of 0.28%), Icelander (2.1%, a difference of 0.42%), Lebanese (2.1%, a difference of 0.45%), Immigrants from Jordan (2.0%, a difference of 0.48%), and Immigrants from Southern Europe (2.0%, a difference of 0.50%).
| Demographics | Rating | Rank | Doctorate Degree |
| Immigrants | Italy | 96.9 /100 | #113 | Exceptional 2.1% |
| Immigrants | Croatia | 96.8 /100 | #114 | Exceptional 2.1% |
| Taiwanese | 96.7 /100 | #115 | Exceptional 2.1% |
| Maltese | 96.2 /100 | #116 | Exceptional 2.1% |
| Lebanese | 96.0 /100 | #117 | Exceptional 2.1% |
| Icelanders | 96.0 /100 | #118 | Exceptional 2.1% |
| Pakistanis | 95.8 /100 | #119 | Exceptional 2.0% |
| Immigrants | Morocco | 95.5 /100 | #120 | Exceptional 2.0% |
| Immigrants | Jordan | 94.8 /100 | #121 | Exceptional 2.0% |
| Immigrants | Southern Europe | 94.7 /100 | #122 | Exceptional 2.0% |
| Croatians | 94.0 /100 | #123 | Exceptional 2.0% |
| Ute | 93.2 /100 | #124 | Exceptional 2.0% |
| Moroccans | 93.0 /100 | #125 | Exceptional 2.0% |
| Jordanians | 92.1 /100 | #126 | Exceptional 2.0% |
| Palestinians | 92.0 /100 | #127 | Exceptional 2.0% |