Celtic vs Immigrants from Morocco 6th Grade
COMPARE
Celtic
Immigrants from Morocco
6th Grade
6th Grade Comparison
Celtics
Immigrants from Morocco
97.8%
6TH GRADE
99.9/ 100
METRIC RATING
48th/ 347
METRIC RANK
96.7%
6TH GRADE
6.2/ 100
METRIC RATING
220th/ 347
METRIC RANK
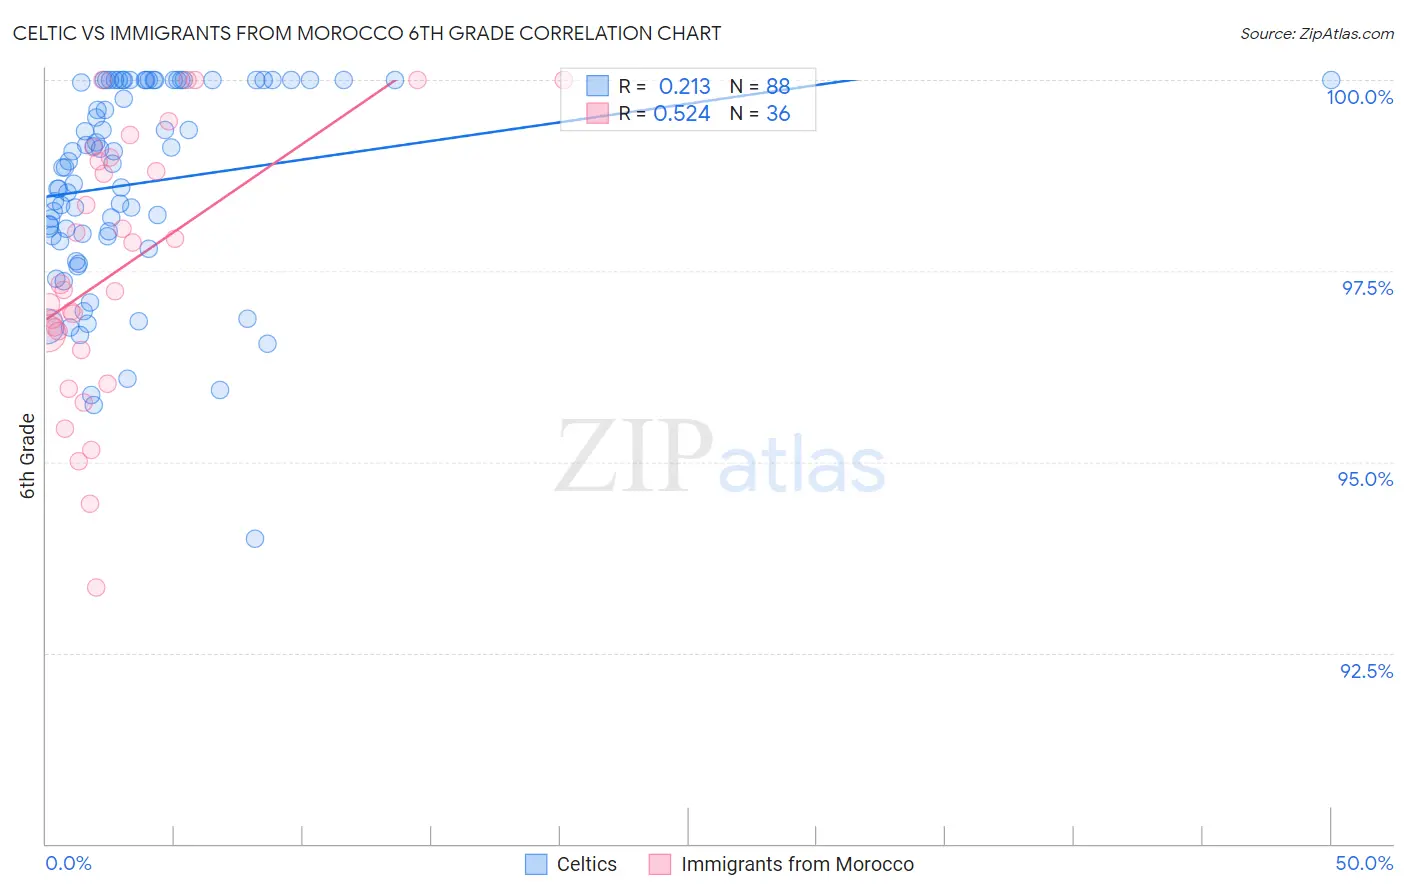
Celtic vs Immigrants from Morocco 6th Grade Correlation Chart
The statistical analysis conducted on geographies consisting of 168,875,705 people shows a weak positive correlation between the proportion of Celtics and percentage of population with at least 6th grade education in the United States with a correlation coefficient (R) of 0.213 and weighted average of 97.8%. Similarly, the statistical analysis conducted on geographies consisting of 178,910,634 people shows a substantial positive correlation between the proportion of Immigrants from Morocco and percentage of population with at least 6th grade education in the United States with a correlation coefficient (R) of 0.524 and weighted average of 96.7%, a difference of 1.1%.
6th Grade Correlation Summary
| Measurement | Celtic | Immigrants from Morocco |
| Minimum | 94.0% | 93.4% |
| Maximum | 100.0% | 100.0% |
| Range | 6.0% | 6.6% |
| Mean | 98.6% | 97.5% |
| Median | 98.9% | 97.3% |
| Interquartile 25% (IQ1) | 98.0% | 96.6% |
| Interquartile 75% (IQ3) | 100.0% | 99.0% |
| Interquartile Range (IQR) | 2.0% | 2.4% |
| Standard Deviation (Sample) | 1.3% | 1.7% |
| Standard Deviation (Population) | 1.3% | 1.7% |
Similar Demographics by 6th Grade
Demographics Similar to Celtics by 6th Grade
In terms of 6th grade, the demographic groups most similar to Celtics are Native Hawaiian (97.8%, a difference of 0.0%), Estonian (97.8%, a difference of 0.0%), Immigrants from Scotland (97.8%, a difference of 0.0%), Arapaho (97.8%, a difference of 0.010%), and Maltese (97.8%, a difference of 0.010%).
| Demographics | Rating | Rank | 6th Grade |
| Eastern Europeans | 99.9 /100 | #41 | Exceptional 97.9% |
| Hungarians | 99.9 /100 | #42 | Exceptional 97.8% |
| Northern Europeans | 99.9 /100 | #43 | Exceptional 97.8% |
| Czechoslovakians | 99.9 /100 | #44 | Exceptional 97.8% |
| Bulgarians | 99.9 /100 | #45 | Exceptional 97.8% |
| Arapaho | 99.9 /100 | #46 | Exceptional 97.8% |
| Native Hawaiians | 99.9 /100 | #47 | Exceptional 97.8% |
| Celtics | 99.9 /100 | #48 | Exceptional 97.8% |
| Estonians | 99.8 /100 | #49 | Exceptional 97.8% |
| Immigrants | Scotland | 99.8 /100 | #50 | Exceptional 97.8% |
| Maltese | 99.8 /100 | #51 | Exceptional 97.8% |
| Australians | 99.8 /100 | #52 | Exceptional 97.8% |
| Slavs | 99.8 /100 | #53 | Exceptional 97.8% |
| Creek | 99.8 /100 | #54 | Exceptional 97.7% |
| Aleuts | 99.8 /100 | #55 | Exceptional 97.7% |
Demographics Similar to Immigrants from Morocco by 6th Grade
In terms of 6th grade, the demographic groups most similar to Immigrants from Morocco are Tongan (96.7%, a difference of 0.0%), Costa Rican (96.8%, a difference of 0.010%), Immigrants from Syria (96.7%, a difference of 0.010%), Liberian (96.8%, a difference of 0.020%), and Navajo (96.8%, a difference of 0.020%).
| Demographics | Rating | Rank | 6th Grade |
| Immigrants | Sudan | 8.7 /100 | #213 | Tragic 96.8% |
| Portuguese | 8.2 /100 | #214 | Tragic 96.8% |
| Sierra Leoneans | 8.0 /100 | #215 | Tragic 96.8% |
| Paiute | 7.8 /100 | #216 | Tragic 96.8% |
| Liberians | 7.5 /100 | #217 | Tragic 96.8% |
| Navajo | 7.3 /100 | #218 | Tragic 96.8% |
| Costa Ricans | 6.8 /100 | #219 | Tragic 96.8% |
| Immigrants | Morocco | 6.2 /100 | #220 | Tragic 96.7% |
| Tongans | 6.1 /100 | #221 | Tragic 96.7% |
| Immigrants | Syria | 5.9 /100 | #222 | Tragic 96.7% |
| Bahamians | 4.8 /100 | #223 | Tragic 96.7% |
| Immigrants | Southern Europe | 4.4 /100 | #224 | Tragic 96.7% |
| Immigrants | Pakistan | 4.4 /100 | #225 | Tragic 96.7% |
| Immigrants | Panama | 4.2 /100 | #226 | Tragic 96.7% |
| Immigrants | Western Asia | 4.1 /100 | #227 | Tragic 96.7% |