Carpatho Rusyn vs Immigrants from Turkey Single Male Poverty
COMPARE
Carpatho Rusyn
Immigrants from Turkey
Single Male Poverty
Single Male Poverty Comparison
Carpatho Rusyns
Immigrants from Turkey
13.4%
SINGLE MALE POVERTY
2.1/ 100
METRIC RATING
242nd/ 347
METRIC RANK
12.1%
SINGLE MALE POVERTY
98.2/ 100
METRIC RATING
91st/ 347
METRIC RANK
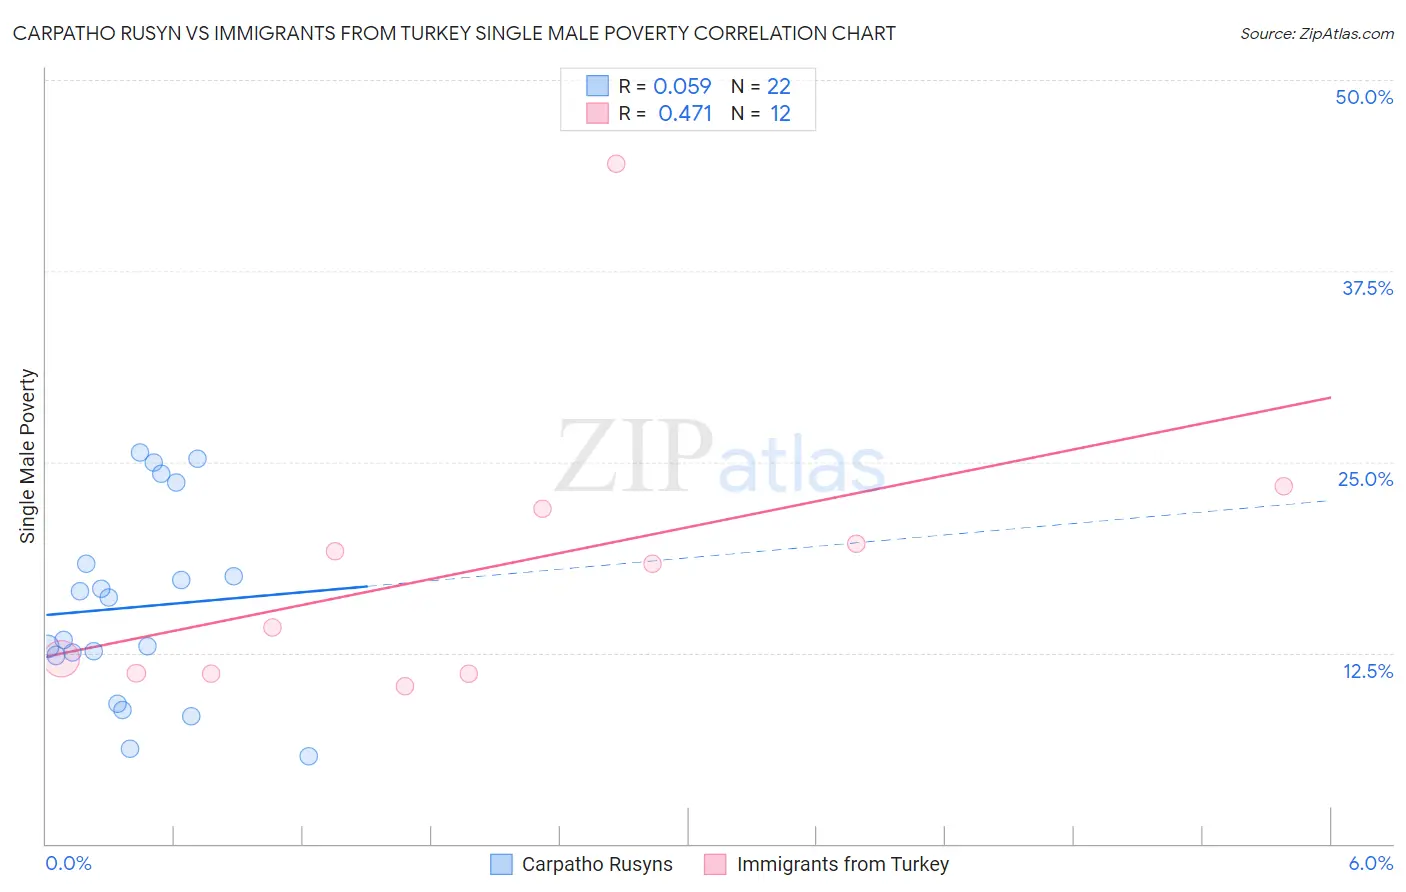
Carpatho Rusyn vs Immigrants from Turkey Single Male Poverty Correlation Chart
The statistical analysis conducted on geographies consisting of 56,393,502 people shows a slight positive correlation between the proportion of Carpatho Rusyns and poverty level among single males in the United States with a correlation coefficient (R) of 0.059 and weighted average of 13.4%. Similarly, the statistical analysis conducted on geographies consisting of 203,227,813 people shows a moderate positive correlation between the proportion of Immigrants from Turkey and poverty level among single males in the United States with a correlation coefficient (R) of 0.471 and weighted average of 12.1%, a difference of 10.9%.
Single Male Poverty Correlation Summary
| Measurement | Carpatho Rusyn | Immigrants from Turkey |
| Minimum | 5.7% | 10.3% |
| Maximum | 25.6% | 44.5% |
| Range | 19.9% | 34.2% |
| Mean | 15.5% | 18.1% |
| Median | 14.7% | 16.2% |
| Interquartile 25% (IQ1) | 12.3% | 11.1% |
| Interquartile 75% (IQ3) | 18.3% | 20.8% |
| Interquartile Range (IQR) | 6.0% | 9.6% |
| Standard Deviation (Sample) | 6.2% | 9.5% |
| Standard Deviation (Population) | 6.1% | 9.1% |
Similar Demographics by Single Male Poverty
Demographics Similar to Carpatho Rusyns by Single Male Poverty
In terms of single male poverty, the demographic groups most similar to Carpatho Rusyns are Immigrants from Germany (13.4%, a difference of 0.010%), Barbadian (13.4%, a difference of 0.050%), Belizean (13.4%, a difference of 0.12%), Immigrants from Senegal (13.5%, a difference of 0.32%), and Czechoslovakian (13.4%, a difference of 0.43%).
| Demographics | Rating | Rank | Single Male Poverty |
| Bangladeshis | 3.7 /100 | #235 | Tragic 13.3% |
| Luxembourgers | 3.6 /100 | #236 | Tragic 13.4% |
| British West Indians | 3.4 /100 | #237 | Tragic 13.4% |
| Immigrants | Ghana | 3.2 /100 | #238 | Tragic 13.4% |
| Czechoslovakians | 3.0 /100 | #239 | Tragic 13.4% |
| Belizeans | 2.3 /100 | #240 | Tragic 13.4% |
| Immigrants | Germany | 2.1 /100 | #241 | Tragic 13.4% |
| Carpatho Rusyns | 2.1 /100 | #242 | Tragic 13.4% |
| Barbadians | 2.1 /100 | #243 | Tragic 13.4% |
| Immigrants | Senegal | 1.7 /100 | #244 | Tragic 13.5% |
| Immigrants | Latin America | 1.3 /100 | #245 | Tragic 13.5% |
| Immigrants | Micronesia | 1.2 /100 | #246 | Tragic 13.5% |
| Belgians | 1.2 /100 | #247 | Tragic 13.5% |
| Czechs | 1.2 /100 | #248 | Tragic 13.5% |
| Spanish | 1.0 /100 | #249 | Tragic 13.6% |
Demographics Similar to Immigrants from Turkey by Single Male Poverty
In terms of single male poverty, the demographic groups most similar to Immigrants from Turkey are South American Indian (12.1%, a difference of 0.050%), Immigrants from Ireland (12.1%, a difference of 0.060%), Spanish American Indian (12.1%, a difference of 0.11%), Immigrants from Bosnia and Herzegovina (12.1%, a difference of 0.17%), and Immigrants from Eritrea (12.1%, a difference of 0.23%).
| Demographics | Rating | Rank | Single Male Poverty |
| Immigrants | Czechoslovakia | 98.6 /100 | #84 | Exceptional 12.1% |
| Turks | 98.5 /100 | #85 | Exceptional 12.1% |
| Immigrants | Israel | 98.5 /100 | #86 | Exceptional 12.1% |
| South Americans | 98.5 /100 | #87 | Exceptional 12.1% |
| Immigrants | Eritrea | 98.5 /100 | #88 | Exceptional 12.1% |
| Immigrants | Ireland | 98.3 /100 | #89 | Exceptional 12.1% |
| South American Indians | 98.3 /100 | #90 | Exceptional 12.1% |
| Immigrants | Turkey | 98.2 /100 | #91 | Exceptional 12.1% |
| Spanish American Indians | 98.0 /100 | #92 | Exceptional 12.1% |
| Immigrants | Bosnia and Herzegovina | 97.9 /100 | #93 | Exceptional 12.1% |
| Colombians | 97.8 /100 | #94 | Exceptional 12.2% |
| Mongolians | 97.7 /100 | #95 | Exceptional 12.2% |
| Immigrants | Sweden | 97.5 /100 | #96 | Exceptional 12.2% |
| Immigrants | Italy | 97.4 /100 | #97 | Exceptional 12.2% |
| Guamanians/Chamorros | 97.4 /100 | #98 | Exceptional 12.2% |