Carpatho Rusyn vs Immigrants from the Azores Single Male Poverty
COMPARE
Carpatho Rusyn
Immigrants from the Azores
Single Male Poverty
Single Male Poverty Comparison
Carpatho Rusyns
Immigrants from the Azores
13.4%
SINGLE MALE POVERTY
2.1/ 100
METRIC RATING
242nd/ 347
METRIC RANK
13.2%
SINGLE MALE POVERTY
9.3/ 100
METRIC RATING
223rd/ 347
METRIC RANK
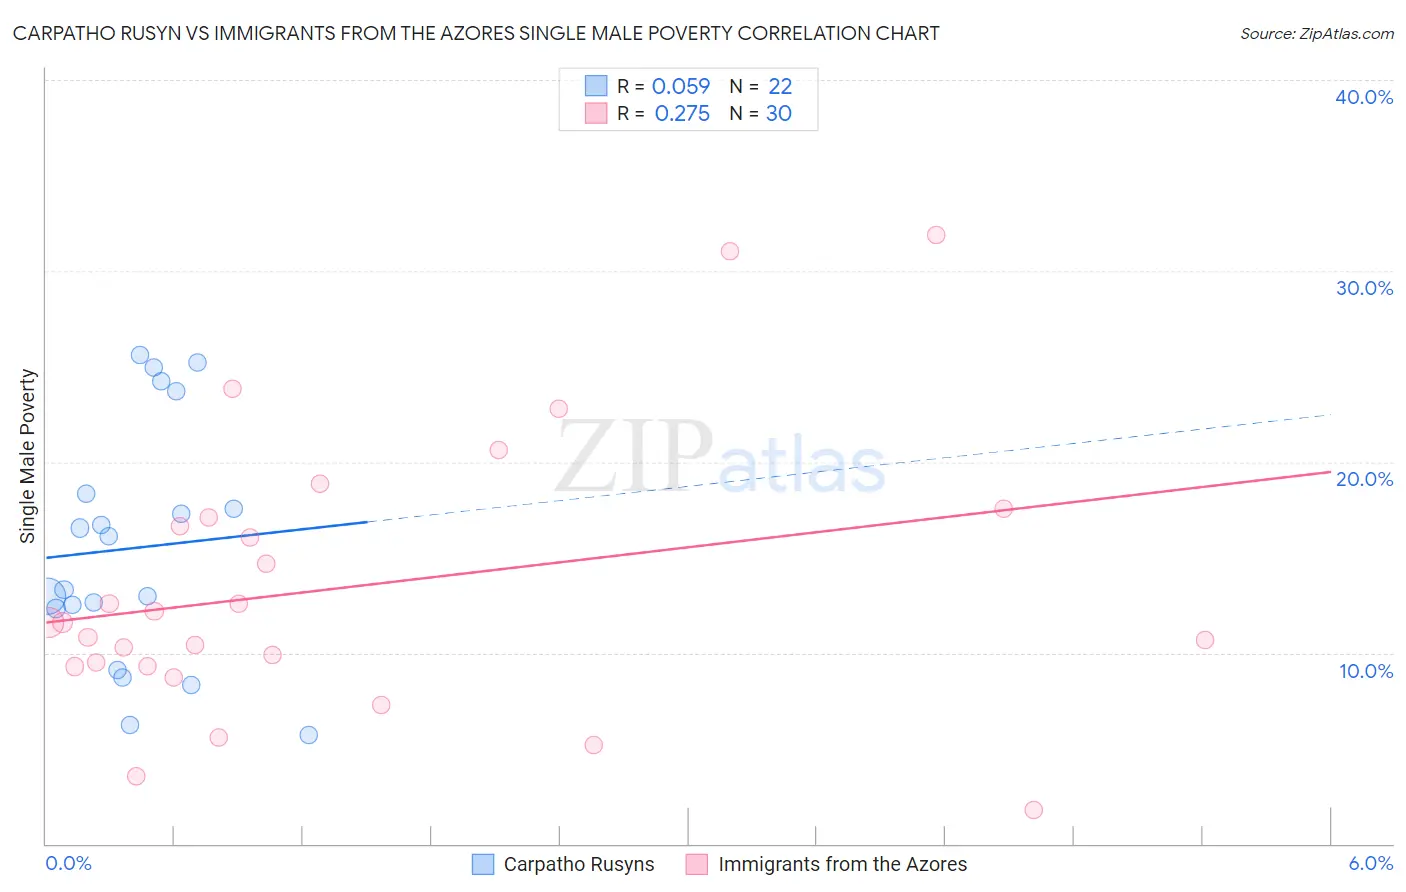
Carpatho Rusyn vs Immigrants from the Azores Single Male Poverty Correlation Chart
The statistical analysis conducted on geographies consisting of 56,393,502 people shows a slight positive correlation between the proportion of Carpatho Rusyns and poverty level among single males in the United States with a correlation coefficient (R) of 0.059 and weighted average of 13.4%. Similarly, the statistical analysis conducted on geographies consisting of 43,584,475 people shows a weak positive correlation between the proportion of Immigrants from the Azores and poverty level among single males in the United States with a correlation coefficient (R) of 0.275 and weighted average of 13.2%, a difference of 2.0%.
Single Male Poverty Correlation Summary
| Measurement | Carpatho Rusyn | Immigrants from the Azores |
| Minimum | 5.7% | 1.7% |
| Maximum | 25.6% | 31.9% |
| Range | 19.9% | 30.2% |
| Mean | 15.5% | 13.5% |
| Median | 14.7% | 11.6% |
| Interquartile 25% (IQ1) | 12.3% | 9.3% |
| Interquartile 75% (IQ3) | 18.3% | 17.1% |
| Interquartile Range (IQR) | 6.0% | 7.8% |
| Standard Deviation (Sample) | 6.2% | 7.2% |
| Standard Deviation (Population) | 6.1% | 7.1% |
Demographics Similar to Carpatho Rusyns and Immigrants from the Azores by Single Male Poverty
In terms of single male poverty, the demographic groups most similar to Carpatho Rusyns are Immigrants from Germany (13.4%, a difference of 0.010%), Belizean (13.4%, a difference of 0.12%), Czechoslovakian (13.4%, a difference of 0.43%), Immigrants from Ghana (13.4%, a difference of 0.51%), and British West Indian (13.4%, a difference of 0.61%). Similarly, the demographic groups most similar to Immigrants from the Azores are Somali (13.2%, a difference of 0.030%), Immigrants from Denmark (13.2%, a difference of 0.090%), Immigrants from Western Europe (13.2%, a difference of 0.11%), Jamaican (13.2%, a difference of 0.25%), and Haitian (13.2%, a difference of 0.38%).
| Demographics | Rating | Rank | Single Male Poverty |
| Immigrants | Western Europe | 10.0 /100 | #222 | Poor 13.2% |
| Immigrants | Azores | 9.3 /100 | #223 | Tragic 13.2% |
| Somalis | 9.1 /100 | #224 | Tragic 13.2% |
| Immigrants | Denmark | 8.7 /100 | #225 | Tragic 13.2% |
| Jamaicans | 7.7 /100 | #226 | Tragic 13.2% |
| Haitians | 7.0 /100 | #227 | Tragic 13.2% |
| Lebanese | 6.6 /100 | #228 | Tragic 13.2% |
| Europeans | 6.2 /100 | #229 | Tragic 13.3% |
| Ghanaians | 6.1 /100 | #230 | Tragic 13.3% |
| Slavs | 5.3 /100 | #231 | Tragic 13.3% |
| Immigrants | Caribbean | 5.0 /100 | #232 | Tragic 13.3% |
| British | 4.0 /100 | #233 | Tragic 13.3% |
| Canadians | 4.0 /100 | #234 | Tragic 13.3% |
| Bangladeshis | 3.7 /100 | #235 | Tragic 13.3% |
| Luxembourgers | 3.6 /100 | #236 | Tragic 13.4% |
| British West Indians | 3.4 /100 | #237 | Tragic 13.4% |
| Immigrants | Ghana | 3.2 /100 | #238 | Tragic 13.4% |
| Czechoslovakians | 3.0 /100 | #239 | Tragic 13.4% |
| Belizeans | 2.3 /100 | #240 | Tragic 13.4% |
| Immigrants | Germany | 2.1 /100 | #241 | Tragic 13.4% |
| Carpatho Rusyns | 2.1 /100 | #242 | Tragic 13.4% |