Carpatho Rusyn vs Puerto Rican Family Households
COMPARE
Carpatho Rusyn
Puerto Rican
Family Households
Family Households Comparison
Carpatho Rusyns
Puerto Ricans
61.1%
FAMILY HOUSEHOLDS
0.0/ 100
METRIC RATING
335th/ 347
METRIC RANK
64.2%
FAMILY HOUSEHOLDS
33.4/ 100
METRIC RATING
184th/ 347
METRIC RANK
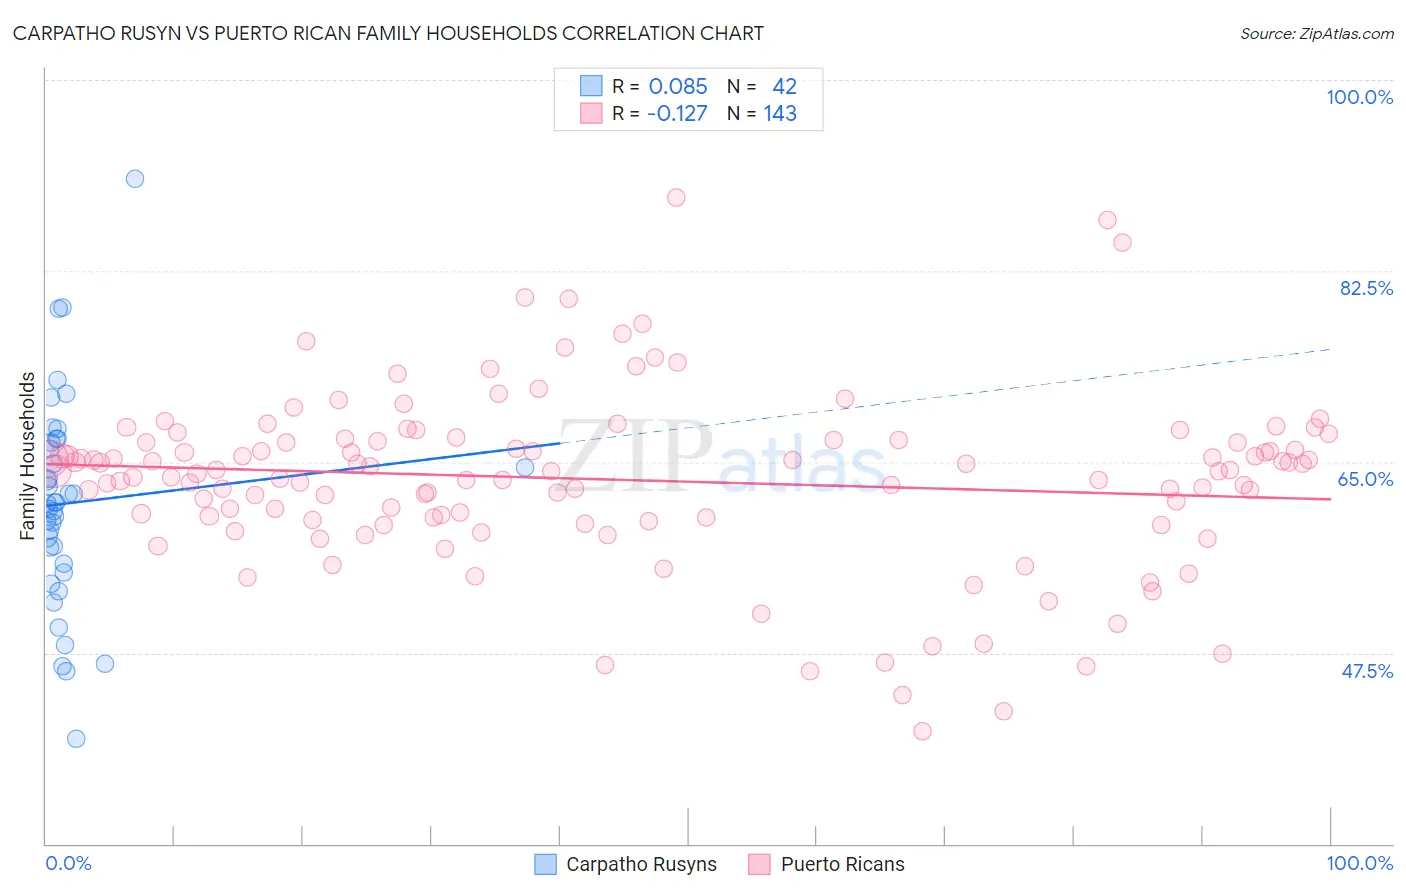
Carpatho Rusyn vs Puerto Rican Family Households Correlation Chart
The statistical analysis conducted on geographies consisting of 58,871,690 people shows a slight positive correlation between the proportion of Carpatho Rusyns and percentage of family households in the United States with a correlation coefficient (R) of 0.085 and weighted average of 61.1%. Similarly, the statistical analysis conducted on geographies consisting of 527,724,488 people shows a poor negative correlation between the proportion of Puerto Ricans and percentage of family households in the United States with a correlation coefficient (R) of -0.127 and weighted average of 64.2%, a difference of 5.0%.
Family Households Correlation Summary
| Measurement | Carpatho Rusyn | Puerto Rican |
| Minimum | 39.6% | 40.3% |
| Maximum | 91.0% | 89.2% |
| Range | 51.3% | 48.9% |
| Mean | 61.2% | 63.4% |
| Median | 61.2% | 64.2% |
| Interquartile 25% (IQ1) | 55.7% | 59.9% |
| Interquartile 75% (IQ3) | 66.8% | 67.0% |
| Interquartile Range (IQR) | 11.1% | 7.1% |
| Standard Deviation (Sample) | 9.7% | 8.0% |
| Standard Deviation (Population) | 9.6% | 8.0% |
Similar Demographics by Family Households
Demographics Similar to Carpatho Rusyns by Family Households
In terms of family households, the demographic groups most similar to Carpatho Rusyns are Immigrants from Eastern Africa (61.1%, a difference of 0.12%), Immigrants from Ethiopia (61.2%, a difference of 0.20%), Ethiopian (61.2%, a difference of 0.28%), German Russian (60.9%, a difference of 0.28%), and Soviet Union (60.9%, a difference of 0.28%).
| Demographics | Rating | Rank | Family Households |
| Kiowa | 0.0 /100 | #328 | Tragic 61.4% |
| Cambodians | 0.0 /100 | #329 | Tragic 61.4% |
| Immigrants | Australia | 0.0 /100 | #330 | Tragic 61.3% |
| Immigrants | France | 0.0 /100 | #331 | Tragic 61.3% |
| Ethiopians | 0.0 /100 | #332 | Tragic 61.2% |
| Immigrants | Ethiopia | 0.0 /100 | #333 | Tragic 61.2% |
| Immigrants | Eastern Africa | 0.0 /100 | #334 | Tragic 61.1% |
| Carpatho Rusyns | 0.0 /100 | #335 | Tragic 61.1% |
| German Russians | 0.0 /100 | #336 | Tragic 60.9% |
| Soviet Union | 0.0 /100 | #337 | Tragic 60.9% |
| Immigrants | Eritrea | 0.0 /100 | #338 | Tragic 60.8% |
| Immigrants | Saudi Arabia | 0.0 /100 | #339 | Tragic 60.7% |
| Immigrants | Sudan | 0.0 /100 | #340 | Tragic 60.2% |
| Immigrants | Senegal | 0.0 /100 | #341 | Tragic 60.1% |
| Sudanese | 0.0 /100 | #342 | Tragic 60.0% |
Demographics Similar to Puerto Ricans by Family Households
In terms of family households, the demographic groups most similar to Puerto Ricans are Creek (64.2%, a difference of 0.010%), Immigrants from Honduras (64.2%, a difference of 0.020%), Immigrants from Trinidad and Tobago (64.2%, a difference of 0.020%), Ukrainian (64.2%, a difference of 0.020%), and Immigrants from Iran (64.1%, a difference of 0.050%).
| Demographics | Rating | Rank | Family Households |
| Immigrants | Micronesia | 42.3 /100 | #177 | Average 64.2% |
| Jamaicans | 40.6 /100 | #178 | Average 64.2% |
| Immigrants | Ukraine | 38.2 /100 | #179 | Fair 64.2% |
| Immigrants | Honduras | 35.0 /100 | #180 | Fair 64.2% |
| Immigrants | Trinidad and Tobago | 34.9 /100 | #181 | Fair 64.2% |
| Ukrainians | 34.6 /100 | #182 | Fair 64.2% |
| Creek | 34.1 /100 | #183 | Fair 64.2% |
| Puerto Ricans | 33.4 /100 | #184 | Fair 64.2% |
| Immigrants | Iran | 30.4 /100 | #185 | Fair 64.1% |
| Spanish Americans | 30.1 /100 | #186 | Fair 64.1% |
| Northern Europeans | 28.2 /100 | #187 | Fair 64.1% |
| Paraguayans | 26.7 /100 | #188 | Fair 64.1% |
| Immigrants | Western Asia | 25.3 /100 | #189 | Fair 64.1% |
| Zimbabweans | 24.7 /100 | #190 | Fair 64.1% |
| Arabs | 24.5 /100 | #191 | Fair 64.1% |