Carpatho Rusyn vs Fijian Single Male Poverty
COMPARE
Carpatho Rusyn
Fijian
Single Male Poverty
Single Male Poverty Comparison
Carpatho Rusyns
Fijians
13.4%
SINGLE MALE POVERTY
2.1/ 100
METRIC RATING
242nd/ 347
METRIC RANK
13.8%
SINGLE MALE POVERTY
0.3/ 100
METRIC RATING
262nd/ 347
METRIC RANK
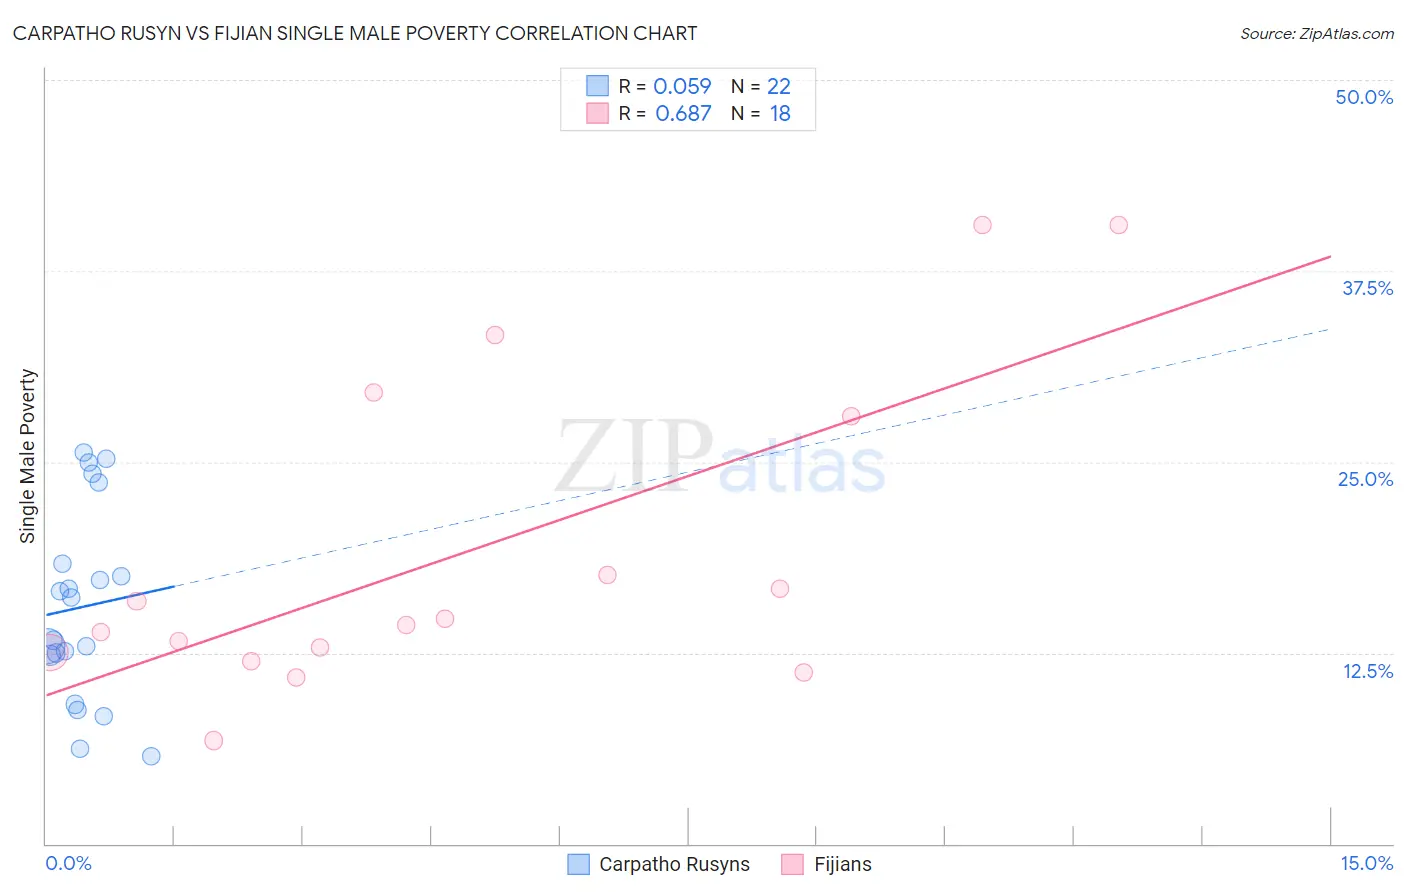
Carpatho Rusyn vs Fijian Single Male Poverty Correlation Chart
The statistical analysis conducted on geographies consisting of 56,393,502 people shows a slight positive correlation between the proportion of Carpatho Rusyns and poverty level among single males in the United States with a correlation coefficient (R) of 0.059 and weighted average of 13.4%. Similarly, the statistical analysis conducted on geographies consisting of 54,470,784 people shows a significant positive correlation between the proportion of Fijians and poverty level among single males in the United States with a correlation coefficient (R) of 0.687 and weighted average of 13.8%, a difference of 2.7%.
Single Male Poverty Correlation Summary
| Measurement | Carpatho Rusyn | Fijian |
| Minimum | 5.7% | 6.8% |
| Maximum | 25.6% | 40.5% |
| Range | 19.9% | 33.8% |
| Mean | 15.5% | 19.1% |
| Median | 14.7% | 14.5% |
| Interquartile 25% (IQ1) | 12.3% | 12.5% |
| Interquartile 75% (IQ3) | 18.3% | 28.0% |
| Interquartile Range (IQR) | 6.0% | 15.5% |
| Standard Deviation (Sample) | 6.2% | 10.4% |
| Standard Deviation (Population) | 6.1% | 10.1% |
Demographics Similar to Carpatho Rusyns and Fijians by Single Male Poverty
In terms of single male poverty, the demographic groups most similar to Carpatho Rusyns are Barbadian (13.4%, a difference of 0.050%), Immigrants from Senegal (13.5%, a difference of 0.32%), Immigrants from Latin America (13.5%, a difference of 0.59%), Immigrants from Micronesia (13.5%, a difference of 0.69%), and Belgian (13.5%, a difference of 0.70%). Similarly, the demographic groups most similar to Fijians are Hungarian (13.8%, a difference of 0.17%), Swiss (13.8%, a difference of 0.22%), Guatemalan (13.8%, a difference of 0.29%), Immigrants from Guatemala (13.8%, a difference of 0.33%), and Immigrants from Central America (13.8%, a difference of 0.40%).
| Demographics | Rating | Rank | Single Male Poverty |
| Carpatho Rusyns | 2.1 /100 | #242 | Tragic 13.4% |
| Barbadians | 2.1 /100 | #243 | Tragic 13.4% |
| Immigrants | Senegal | 1.7 /100 | #244 | Tragic 13.5% |
| Immigrants | Latin America | 1.3 /100 | #245 | Tragic 13.5% |
| Immigrants | Micronesia | 1.2 /100 | #246 | Tragic 13.5% |
| Belgians | 1.2 /100 | #247 | Tragic 13.5% |
| Czechs | 1.2 /100 | #248 | Tragic 13.5% |
| Spanish | 1.0 /100 | #249 | Tragic 13.6% |
| Immigrants | Somalia | 1.0 /100 | #250 | Tragic 13.6% |
| Immigrants | Zaire | 0.9 /100 | #251 | Tragic 13.6% |
| Finns | 0.9 /100 | #252 | Tragic 13.6% |
| German Russians | 0.8 /100 | #253 | Tragic 13.6% |
| Sub-Saharan Africans | 0.5 /100 | #254 | Tragic 13.7% |
| Spaniards | 0.4 /100 | #255 | Tragic 13.7% |
| Immigrants | Belize | 0.4 /100 | #256 | Tragic 13.7% |
| Immigrants | Central America | 0.3 /100 | #257 | Tragic 13.8% |
| Immigrants | Guatemala | 0.3 /100 | #258 | Tragic 13.8% |
| Guatemalans | 0.3 /100 | #259 | Tragic 13.8% |
| Swiss | 0.3 /100 | #260 | Tragic 13.8% |
| Hungarians | 0.3 /100 | #261 | Tragic 13.8% |
| Fijians | 0.3 /100 | #262 | Tragic 13.8% |