Carpatho Rusyn vs Jordanian Single Male Poverty
COMPARE
Carpatho Rusyn
Jordanian
Single Male Poverty
Single Male Poverty Comparison
Carpatho Rusyns
Jordanians
13.4%
SINGLE MALE POVERTY
2.1/ 100
METRIC RATING
242nd/ 347
METRIC RANK
12.3%
SINGLE MALE POVERTY
95.9/ 100
METRIC RATING
105th/ 347
METRIC RANK
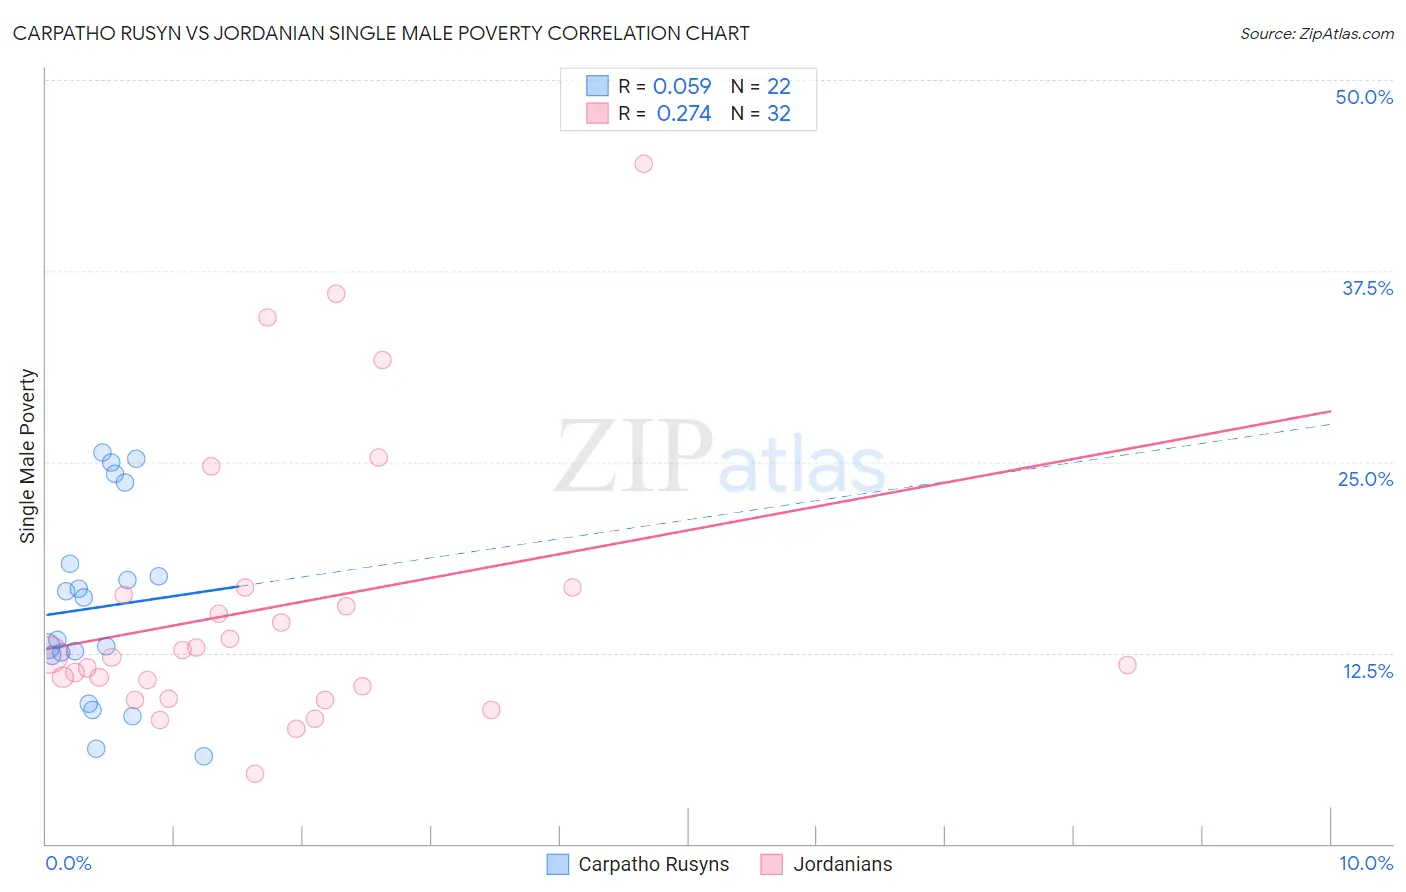
Carpatho Rusyn vs Jordanian Single Male Poverty Correlation Chart
The statistical analysis conducted on geographies consisting of 56,393,502 people shows a slight positive correlation between the proportion of Carpatho Rusyns and poverty level among single males in the United States with a correlation coefficient (R) of 0.059 and weighted average of 13.4%. Similarly, the statistical analysis conducted on geographies consisting of 156,040,584 people shows a weak positive correlation between the proportion of Jordanians and poverty level among single males in the United States with a correlation coefficient (R) of 0.274 and weighted average of 12.3%, a difference of 9.6%.
Single Male Poverty Correlation Summary
| Measurement | Carpatho Rusyn | Jordanian |
| Minimum | 5.7% | 4.6% |
| Maximum | 25.6% | 44.5% |
| Range | 19.9% | 39.9% |
| Mean | 15.5% | 15.6% |
| Median | 14.7% | 12.3% |
| Interquartile 25% (IQ1) | 12.3% | 9.9% |
| Interquartile 75% (IQ3) | 18.3% | 16.5% |
| Interquartile Range (IQR) | 6.0% | 6.6% |
| Standard Deviation (Sample) | 6.2% | 9.3% |
| Standard Deviation (Population) | 6.1% | 9.2% |
Similar Demographics by Single Male Poverty
Demographics Similar to Carpatho Rusyns by Single Male Poverty
In terms of single male poverty, the demographic groups most similar to Carpatho Rusyns are Immigrants from Germany (13.4%, a difference of 0.010%), Barbadian (13.4%, a difference of 0.050%), Belizean (13.4%, a difference of 0.12%), Immigrants from Senegal (13.5%, a difference of 0.32%), and Czechoslovakian (13.4%, a difference of 0.43%).
| Demographics | Rating | Rank | Single Male Poverty |
| Bangladeshis | 3.7 /100 | #235 | Tragic 13.3% |
| Luxembourgers | 3.6 /100 | #236 | Tragic 13.4% |
| British West Indians | 3.4 /100 | #237 | Tragic 13.4% |
| Immigrants | Ghana | 3.2 /100 | #238 | Tragic 13.4% |
| Czechoslovakians | 3.0 /100 | #239 | Tragic 13.4% |
| Belizeans | 2.3 /100 | #240 | Tragic 13.4% |
| Immigrants | Germany | 2.1 /100 | #241 | Tragic 13.4% |
| Carpatho Rusyns | 2.1 /100 | #242 | Tragic 13.4% |
| Barbadians | 2.1 /100 | #243 | Tragic 13.4% |
| Immigrants | Senegal | 1.7 /100 | #244 | Tragic 13.5% |
| Immigrants | Latin America | 1.3 /100 | #245 | Tragic 13.5% |
| Immigrants | Micronesia | 1.2 /100 | #246 | Tragic 13.5% |
| Belgians | 1.2 /100 | #247 | Tragic 13.5% |
| Czechs | 1.2 /100 | #248 | Tragic 13.5% |
| Spanish | 1.0 /100 | #249 | Tragic 13.6% |
Demographics Similar to Jordanians by Single Male Poverty
In terms of single male poverty, the demographic groups most similar to Jordanians are Immigrants from Morocco (12.3%, a difference of 0.080%), Iraqi (12.3%, a difference of 0.26%), Immigrants from Eastern Africa (12.3%, a difference of 0.28%), Immigrants from Kazakhstan (12.2%, a difference of 0.32%), and Immigrants from Armenia (12.2%, a difference of 0.33%).
| Demographics | Rating | Rank | Single Male Poverty |
| Guamanians/Chamorros | 97.4 /100 | #98 | Exceptional 12.2% |
| Immigrants | Cuba | 97.3 /100 | #99 | Exceptional 12.2% |
| Immigrants | Australia | 97.1 /100 | #100 | Exceptional 12.2% |
| Immigrants | Latvia | 97.0 /100 | #101 | Exceptional 12.2% |
| Immigrants | Europe | 97.0 /100 | #102 | Exceptional 12.2% |
| Immigrants | Armenia | 96.7 /100 | #103 | Exceptional 12.2% |
| Immigrants | Kazakhstan | 96.7 /100 | #104 | Exceptional 12.2% |
| Jordanians | 95.9 /100 | #105 | Exceptional 12.3% |
| Immigrants | Morocco | 95.6 /100 | #106 | Exceptional 12.3% |
| Iraqis | 95.1 /100 | #107 | Exceptional 12.3% |
| Immigrants | Eastern Africa | 95.0 /100 | #108 | Exceptional 12.3% |
| Ugandans | 94.5 /100 | #109 | Exceptional 12.3% |
| Immigrants | Portugal | 93.6 /100 | #110 | Exceptional 12.3% |
| Immigrants | North Macedonia | 93.6 /100 | #111 | Exceptional 12.3% |
| Kenyans | 93.3 /100 | #112 | Exceptional 12.4% |