Carpatho Rusyn vs Immigrants from Singapore Householder Income Under 25 years
COMPARE
Carpatho Rusyn
Immigrants from Singapore
Householder Income Under 25 years
Householder Income Under 25 years Comparison
Carpatho Rusyns
Immigrants from Singapore
$49,113
HOUSEHOLDER INCOME UNDER 25 YEARS
0.1/ 100
METRIC RATING
284th/ 347
METRIC RANK
$56,835
HOUSEHOLDER INCOME UNDER 25 YEARS
100.0/ 100
METRIC RATING
24th/ 347
METRIC RANK
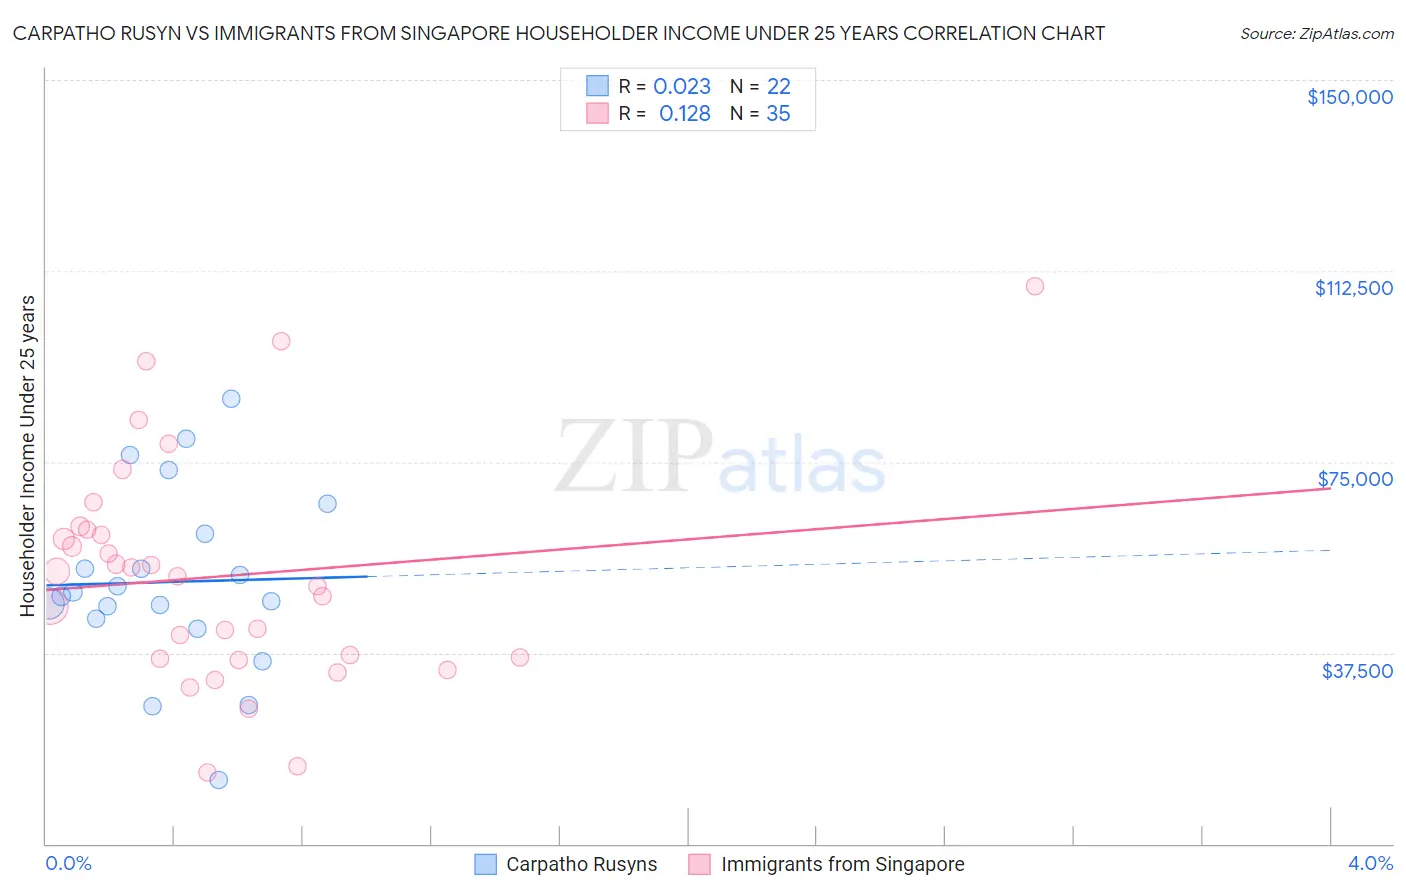
Carpatho Rusyn vs Immigrants from Singapore Householder Income Under 25 years Correlation Chart
The statistical analysis conducted on geographies consisting of 54,713,704 people shows no correlation between the proportion of Carpatho Rusyns and household income with householder under the age of 25 in the United States with a correlation coefficient (R) of 0.023 and weighted average of $49,113. Similarly, the statistical analysis conducted on geographies consisting of 123,473,430 people shows a poor positive correlation between the proportion of Immigrants from Singapore and household income with householder under the age of 25 in the United States with a correlation coefficient (R) of 0.128 and weighted average of $56,835, a difference of 15.7%.
Householder Income Under 25 years Correlation Summary
| Measurement | Carpatho Rusyn | Immigrants from Singapore |
| Minimum | $12,634 | $14,087 |
| Maximum | $87,344 | $109,471 |
| Range | $74,710 | $95,384 |
| Mean | $51,412 | $52,518 |
| Median | $48,954 | $52,500 |
| Interquartile 25% (IQ1) | $44,244 | $36,250 |
| Interquartile 75% (IQ3) | $60,913 | $61,737 |
| Interquartile Range (IQR) | $16,669 | $25,487 |
| Standard Deviation (Sample) | $17,819 | $21,943 |
| Standard Deviation (Population) | $17,409 | $21,627 |
Similar Demographics by Householder Income Under 25 years
Demographics Similar to Carpatho Rusyns by Householder Income Under 25 years
In terms of householder income under 25 years, the demographic groups most similar to Carpatho Rusyns are Immigrants from Nigeria ($49,174, a difference of 0.12%), Scotch-Irish ($49,039, a difference of 0.15%), French American Indian ($48,977, a difference of 0.28%), Alsatian ($49,267, a difference of 0.31%), and Senegalese ($48,953, a difference of 0.33%).
| Demographics | Rating | Rank | Householder Income Under 25 years |
| Immigrants | Western Africa | 0.2 /100 | #277 | Tragic $49,621 |
| Nigerians | 0.1 /100 | #278 | Tragic $49,416 |
| Apache | 0.1 /100 | #279 | Tragic $49,395 |
| Hmong | 0.1 /100 | #280 | Tragic $49,364 |
| Immigrants | Nonimmigrants | 0.1 /100 | #281 | Tragic $49,348 |
| Alsatians | 0.1 /100 | #282 | Tragic $49,267 |
| Immigrants | Nigeria | 0.1 /100 | #283 | Tragic $49,174 |
| Carpatho Rusyns | 0.1 /100 | #284 | Tragic $49,113 |
| Scotch-Irish | 0.0 /100 | #285 | Tragic $49,039 |
| French American Indians | 0.0 /100 | #286 | Tragic $48,977 |
| Senegalese | 0.0 /100 | #287 | Tragic $48,953 |
| Liberians | 0.0 /100 | #288 | Tragic $48,917 |
| Hondurans | 0.0 /100 | #289 | Tragic $48,885 |
| Americans | 0.0 /100 | #290 | Tragic $48,860 |
| Immigrants | Burma/Myanmar | 0.0 /100 | #291 | Tragic $48,749 |
Demographics Similar to Immigrants from Singapore by Householder Income Under 25 years
In terms of householder income under 25 years, the demographic groups most similar to Immigrants from Singapore are Immigrants from Pakistan ($56,789, a difference of 0.080%), Tongan ($56,972, a difference of 0.24%), Asian ($57,003, a difference of 0.29%), Immigrants from Australia ($56,660, a difference of 0.31%), and Immigrants from Ireland ($57,075, a difference of 0.42%).
| Demographics | Rating | Rank | Householder Income Under 25 years |
| Sierra Leoneans | 100.0 /100 | #17 | Exceptional $57,272 |
| Immigrants | Eastern Asia | 100.0 /100 | #18 | Exceptional $57,123 |
| Bhutanese | 100.0 /100 | #19 | Exceptional $57,078 |
| Immigrants | Ireland | 100.0 /100 | #20 | Exceptional $57,075 |
| Immigrants | Fiji | 100.0 /100 | #21 | Exceptional $57,074 |
| Asians | 100.0 /100 | #22 | Exceptional $57,003 |
| Tongans | 100.0 /100 | #23 | Exceptional $56,972 |
| Immigrants | Singapore | 100.0 /100 | #24 | Exceptional $56,835 |
| Immigrants | Pakistan | 100.0 /100 | #25 | Exceptional $56,789 |
| Immigrants | Australia | 100.0 /100 | #26 | Exceptional $56,660 |
| Immigrants | North Macedonia | 100.0 /100 | #27 | Exceptional $56,503 |
| Immigrants | Peru | 100.0 /100 | #28 | Exceptional $56,384 |
| Immigrants | Asia | 100.0 /100 | #29 | Exceptional $56,379 |
| Immigrants | Moldova | 100.0 /100 | #30 | Exceptional $56,168 |
| Vietnamese | 100.0 /100 | #31 | Exceptional $56,127 |