Brazilian vs British Family Poverty
COMPARE
Brazilian
British
Family Poverty
Family Poverty Comparison
Brazilians
British
8.6%
FAMILY POVERTY
80.1/ 100
METRIC RATING
151st/ 347
METRIC RANK
7.9%
FAMILY POVERTY
97.5/ 100
METRIC RATING
84th/ 347
METRIC RANK
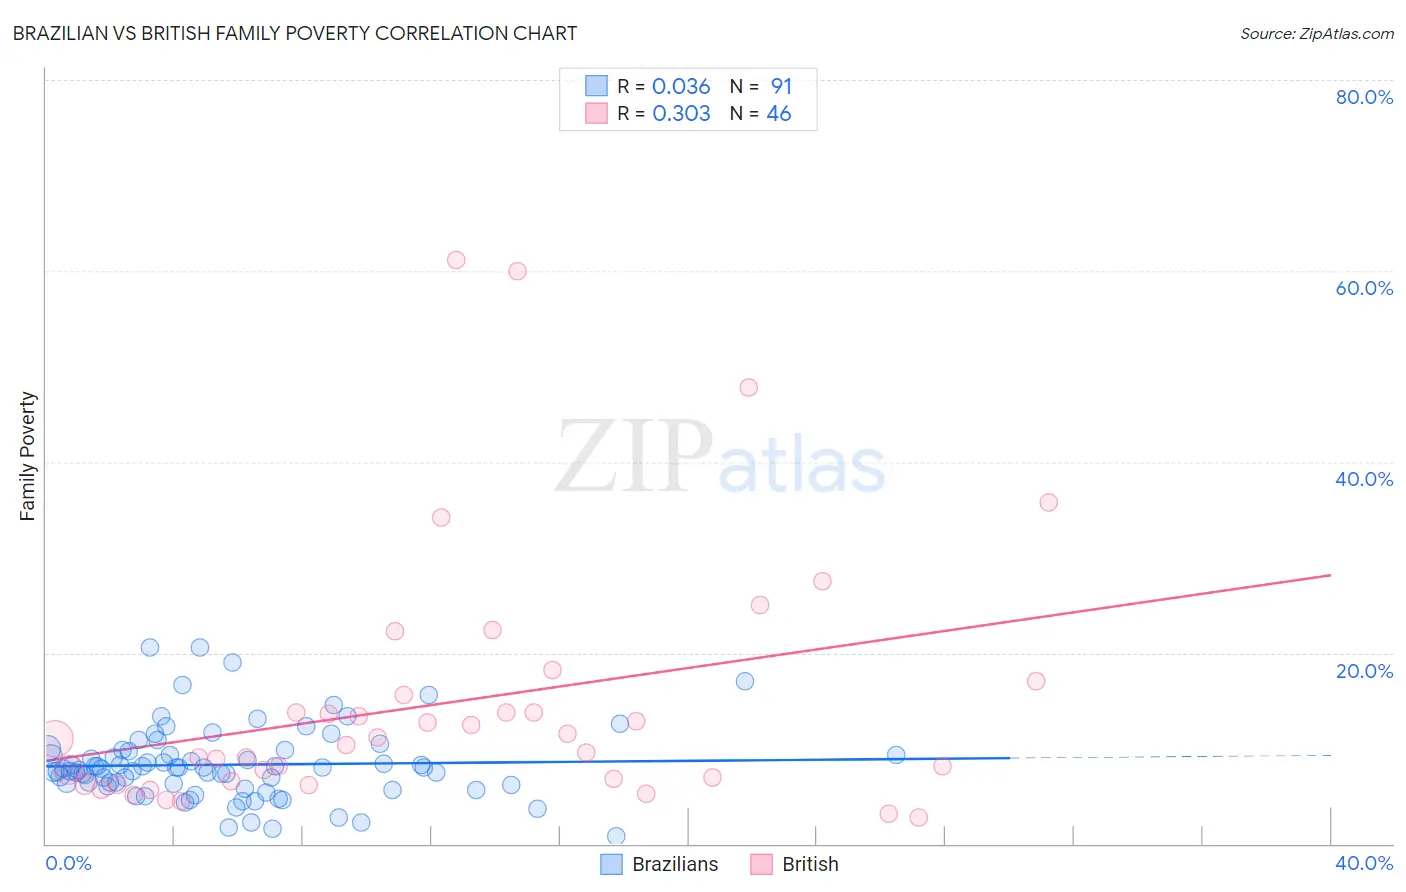
Brazilian vs British Family Poverty Correlation Chart
The statistical analysis conducted on geographies consisting of 323,153,944 people shows no correlation between the proportion of Brazilians and poverty level among families in the United States with a correlation coefficient (R) of 0.036 and weighted average of 8.6%. Similarly, the statistical analysis conducted on geographies consisting of 528,449,567 people shows a mild positive correlation between the proportion of British and poverty level among families in the United States with a correlation coefficient (R) of 0.303 and weighted average of 7.9%, a difference of 8.5%.
Family Poverty Correlation Summary
| Measurement | Brazilian | British |
| Minimum | 0.81% | 2.7% |
| Maximum | 20.6% | 61.1% |
| Range | 19.8% | 58.4% |
| Mean | 8.3% | 14.8% |
| Median | 7.9% | 10.6% |
| Interquartile 25% (IQ1) | 6.2% | 6.6% |
| Interquartile 75% (IQ3) | 9.7% | 15.5% |
| Interquartile Range (IQR) | 3.5% | 9.0% |
| Standard Deviation (Sample) | 3.8% | 13.5% |
| Standard Deviation (Population) | 3.8% | 13.3% |
Similar Demographics by Family Poverty
Demographics Similar to Brazilians by Family Poverty
In terms of family poverty, the demographic groups most similar to Brazilians are Mongolian (8.6%, a difference of 0.050%), Syrian (8.6%, a difference of 0.050%), Samoan (8.6%, a difference of 0.080%), Immigrants from Spain (8.6%, a difference of 0.22%), and Scotch-Irish (8.6%, a difference of 0.45%).
| Demographics | Rating | Rank | Family Poverty |
| Albanians | 83.3 /100 | #144 | Excellent 8.5% |
| Immigrants | South Eastern Asia | 83.2 /100 | #145 | Excellent 8.5% |
| Immigrants | Belarus | 83.2 /100 | #146 | Excellent 8.5% |
| Immigrants | Jordan | 83.0 /100 | #147 | Excellent 8.5% |
| Scotch-Irish | 82.2 /100 | #148 | Excellent 8.6% |
| Mongolians | 80.4 /100 | #149 | Excellent 8.6% |
| Syrians | 80.3 /100 | #150 | Excellent 8.6% |
| Brazilians | 80.1 /100 | #151 | Excellent 8.6% |
| Samoans | 79.8 /100 | #152 | Good 8.6% |
| Immigrants | Spain | 79.1 /100 | #153 | Good 8.6% |
| Immigrants | Vietnam | 75.4 /100 | #154 | Good 8.7% |
| Immigrants | Kuwait | 73.6 /100 | #155 | Good 8.7% |
| Immigrants | Oceania | 71.2 /100 | #156 | Good 8.7% |
| Tsimshian | 69.3 /100 | #157 | Good 8.8% |
| Whites/Caucasians | 69.1 /100 | #158 | Good 8.8% |
Demographics Similar to British by Family Poverty
In terms of family poverty, the demographic groups most similar to British are Slovak (7.9%, a difference of 0.24%), Immigrants from Asia (7.9%, a difference of 0.24%), Scottish (7.9%, a difference of 0.29%), Belgian (8.0%, a difference of 0.37%), and Immigrants from Poland (7.9%, a difference of 0.42%).
| Demographics | Rating | Rank | Family Poverty |
| Ukrainians | 98.0 /100 | #77 | Exceptional 7.9% |
| Immigrants | North America | 97.9 /100 | #78 | Exceptional 7.9% |
| Immigrants | Europe | 97.8 /100 | #79 | Exceptional 7.9% |
| English | 97.8 /100 | #80 | Exceptional 7.9% |
| Irish | 97.8 /100 | #81 | Exceptional 7.9% |
| Immigrants | Poland | 97.8 /100 | #82 | Exceptional 7.9% |
| Slovaks | 97.7 /100 | #83 | Exceptional 7.9% |
| British | 97.5 /100 | #84 | Exceptional 7.9% |
| Immigrants | Asia | 97.4 /100 | #85 | Exceptional 7.9% |
| Scottish | 97.3 /100 | #86 | Exceptional 7.9% |
| Belgians | 97.3 /100 | #87 | Exceptional 8.0% |
| Serbians | 97.2 /100 | #88 | Exceptional 8.0% |
| Immigrants | Denmark | 97.1 /100 | #89 | Exceptional 8.0% |
| Immigrants | England | 97.1 /100 | #90 | Exceptional 8.0% |
| Immigrants | Italy | 97.0 /100 | #91 | Exceptional 8.0% |