Kenyan vs British Family Poverty
COMPARE
Kenyan
British
Family Poverty
Family Poverty Comparison
Kenyans
British
8.9%
FAMILY POVERTY
58.2/ 100
METRIC RATING
170th/ 347
METRIC RANK
7.9%
FAMILY POVERTY
97.5/ 100
METRIC RATING
84th/ 347
METRIC RANK
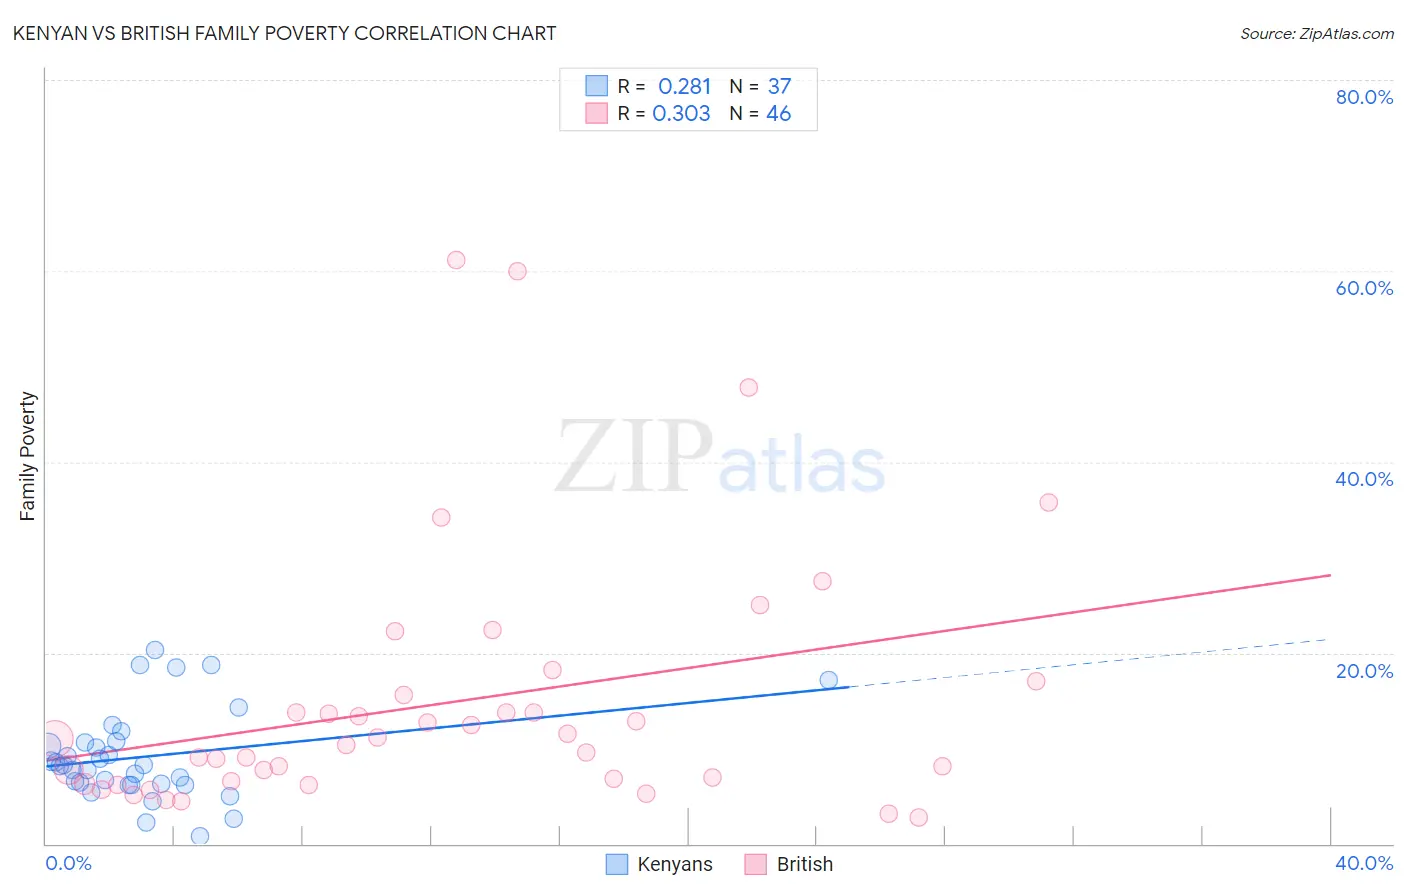
Kenyan vs British Family Poverty Correlation Chart
The statistical analysis conducted on geographies consisting of 168,038,695 people shows a weak positive correlation between the proportion of Kenyans and poverty level among families in the United States with a correlation coefficient (R) of 0.281 and weighted average of 8.9%. Similarly, the statistical analysis conducted on geographies consisting of 528,449,567 people shows a mild positive correlation between the proportion of British and poverty level among families in the United States with a correlation coefficient (R) of 0.303 and weighted average of 7.9%, a difference of 12.4%.
Family Poverty Correlation Summary
| Measurement | Kenyan | British |
| Minimum | 0.77% | 2.7% |
| Maximum | 20.3% | 61.1% |
| Range | 19.5% | 58.4% |
| Mean | 9.1% | 14.8% |
| Median | 8.3% | 10.6% |
| Interquartile 25% (IQ1) | 6.2% | 6.6% |
| Interquartile 75% (IQ3) | 10.7% | 15.5% |
| Interquartile Range (IQR) | 4.5% | 9.0% |
| Standard Deviation (Sample) | 4.7% | 13.5% |
| Standard Deviation (Population) | 4.6% | 13.3% |
Similar Demographics by Family Poverty
Demographics Similar to Kenyans by Family Poverty
In terms of family poverty, the demographic groups most similar to Kenyans are Lebanese (8.9%, a difference of 0.080%), Immigrants from Peru (8.9%, a difference of 0.090%), Immigrants from Chile (8.9%, a difference of 0.19%), Immigrants from Fiji (8.9%, a difference of 0.25%), and Israeli (8.9%, a difference of 0.54%).
| Demographics | Rating | Rank | Family Poverty |
| Pennsylvania Germans | 66.0 /100 | #163 | Good 8.8% |
| Celtics | 64.9 /100 | #164 | Good 8.8% |
| Guamanians/Chamorros | 64.7 /100 | #165 | Good 8.8% |
| Afghans | 63.5 /100 | #166 | Good 8.8% |
| Immigrants | Ethiopia | 62.5 /100 | #167 | Good 8.9% |
| Israelis | 62.1 /100 | #168 | Good 8.9% |
| Immigrants | Chile | 59.6 /100 | #169 | Average 8.9% |
| Kenyans | 58.2 /100 | #170 | Average 8.9% |
| Lebanese | 57.6 /100 | #171 | Average 8.9% |
| Immigrants | Peru | 57.5 /100 | #172 | Average 8.9% |
| Immigrants | Fiji | 56.4 /100 | #173 | Average 8.9% |
| Immigrants | Albania | 50.0 /100 | #174 | Average 9.0% |
| Costa Ricans | 49.3 /100 | #175 | Average 9.0% |
| Immigrants | Syria | 47.5 /100 | #176 | Average 9.0% |
| Hawaiians | 47.2 /100 | #177 | Average 9.0% |
Demographics Similar to British by Family Poverty
In terms of family poverty, the demographic groups most similar to British are Slovak (7.9%, a difference of 0.24%), Immigrants from Asia (7.9%, a difference of 0.24%), Scottish (7.9%, a difference of 0.29%), Belgian (8.0%, a difference of 0.37%), and Immigrants from Poland (7.9%, a difference of 0.42%).
| Demographics | Rating | Rank | Family Poverty |
| Ukrainians | 98.0 /100 | #77 | Exceptional 7.9% |
| Immigrants | North America | 97.9 /100 | #78 | Exceptional 7.9% |
| Immigrants | Europe | 97.8 /100 | #79 | Exceptional 7.9% |
| English | 97.8 /100 | #80 | Exceptional 7.9% |
| Irish | 97.8 /100 | #81 | Exceptional 7.9% |
| Immigrants | Poland | 97.8 /100 | #82 | Exceptional 7.9% |
| Slovaks | 97.7 /100 | #83 | Exceptional 7.9% |
| British | 97.5 /100 | #84 | Exceptional 7.9% |
| Immigrants | Asia | 97.4 /100 | #85 | Exceptional 7.9% |
| Scottish | 97.3 /100 | #86 | Exceptional 7.9% |
| Belgians | 97.3 /100 | #87 | Exceptional 8.0% |
| Serbians | 97.2 /100 | #88 | Exceptional 8.0% |
| Immigrants | Denmark | 97.1 /100 | #89 | Exceptional 8.0% |
| Immigrants | England | 97.1 /100 | #90 | Exceptional 8.0% |
| Immigrants | Italy | 97.0 /100 | #91 | Exceptional 8.0% |