Immigrants from Eastern Europe vs British Family Poverty
COMPARE
Immigrants from Eastern Europe
British
Family Poverty
Family Poverty Comparison
Immigrants from Eastern Europe
British
8.1%
FAMILY POVERTY
95.6/ 100
METRIC RATING
103rd/ 347
METRIC RANK
7.9%
FAMILY POVERTY
97.5/ 100
METRIC RATING
84th/ 347
METRIC RANK
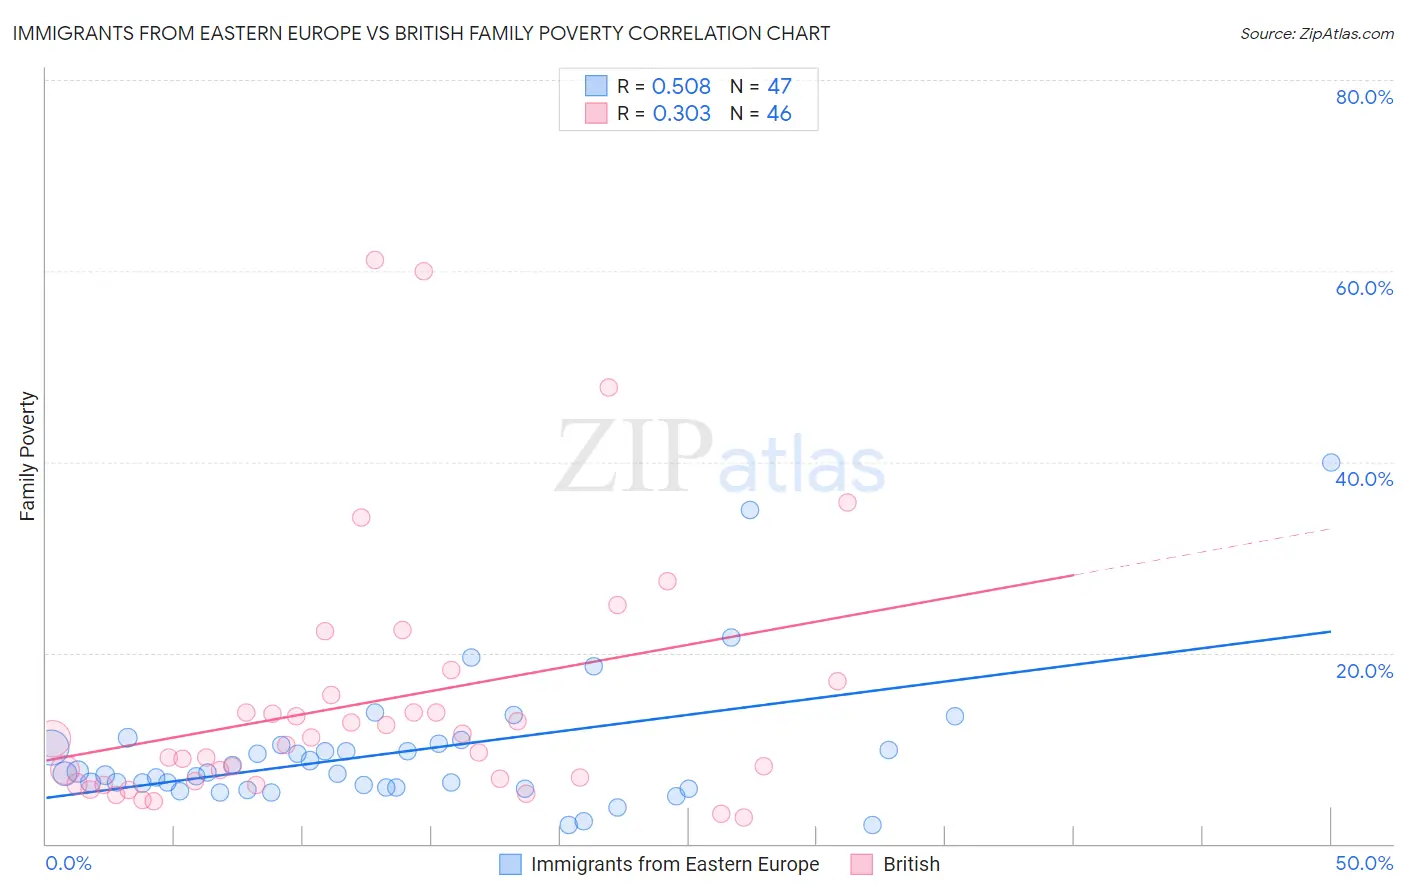
Immigrants from Eastern Europe vs British Family Poverty Correlation Chart
The statistical analysis conducted on geographies consisting of 473,559,356 people shows a substantial positive correlation between the proportion of Immigrants from Eastern Europe and poverty level among families in the United States with a correlation coefficient (R) of 0.508 and weighted average of 8.1%. Similarly, the statistical analysis conducted on geographies consisting of 528,449,567 people shows a mild positive correlation between the proportion of British and poverty level among families in the United States with a correlation coefficient (R) of 0.303 and weighted average of 7.9%, a difference of 2.2%.
Family Poverty Correlation Summary
| Measurement | Immigrants from Eastern Europe | British |
| Minimum | 1.9% | 2.7% |
| Maximum | 40.0% | 61.1% |
| Range | 38.1% | 58.4% |
| Mean | 9.6% | 14.8% |
| Median | 7.4% | 10.6% |
| Interquartile 25% (IQ1) | 5.9% | 6.6% |
| Interquartile 75% (IQ3) | 10.4% | 15.5% |
| Interquartile Range (IQR) | 4.4% | 9.0% |
| Standard Deviation (Sample) | 7.2% | 13.5% |
| Standard Deviation (Population) | 7.1% | 13.3% |
Demographics Similar to Immigrants from Eastern Europe and British by Family Poverty
In terms of family poverty, the demographic groups most similar to Immigrants from Eastern Europe are Immigrants from Indonesia (8.1%, a difference of 0.090%), Immigrants from Norway (8.1%, a difference of 0.10%), New Zealander (8.1%, a difference of 0.13%), Welsh (8.1%, a difference of 0.20%), and Immigrants from South Africa (8.1%, a difference of 0.27%). Similarly, the demographic groups most similar to British are Slovak (7.9%, a difference of 0.24%), Immigrants from Asia (7.9%, a difference of 0.24%), Scottish (7.9%, a difference of 0.29%), Belgian (8.0%, a difference of 0.37%), and Serbian (8.0%, a difference of 0.44%).
| Demographics | Rating | Rank | Family Poverty |
| Slovaks | 97.7 /100 | #83 | Exceptional 7.9% |
| British | 97.5 /100 | #84 | Exceptional 7.9% |
| Immigrants | Asia | 97.4 /100 | #85 | Exceptional 7.9% |
| Scottish | 97.3 /100 | #86 | Exceptional 7.9% |
| Belgians | 97.3 /100 | #87 | Exceptional 8.0% |
| Serbians | 97.2 /100 | #88 | Exceptional 8.0% |
| Immigrants | Denmark | 97.1 /100 | #89 | Exceptional 8.0% |
| Immigrants | England | 97.1 /100 | #90 | Exceptional 8.0% |
| Immigrants | Italy | 97.0 /100 | #91 | Exceptional 8.0% |
| Czechoslovakians | 96.8 /100 | #92 | Exceptional 8.0% |
| Tlingit-Haida | 96.7 /100 | #93 | Exceptional 8.0% |
| Immigrants | Pakistan | 96.6 /100 | #94 | Exceptional 8.0% |
| Immigrants | Philippines | 96.5 /100 | #95 | Exceptional 8.0% |
| Immigrants | Turkey | 96.5 /100 | #96 | Exceptional 8.0% |
| Immigrants | Switzerland | 96.1 /100 | #97 | Exceptional 8.1% |
| Immigrants | South Africa | 95.9 /100 | #98 | Exceptional 8.1% |
| Welsh | 95.8 /100 | #99 | Exceptional 8.1% |
| New Zealanders | 95.8 /100 | #100 | Exceptional 8.1% |
| Immigrants | Norway | 95.7 /100 | #101 | Exceptional 8.1% |
| Immigrants | Indonesia | 95.7 /100 | #102 | Exceptional 8.1% |
| Immigrants | Eastern Europe | 95.6 /100 | #103 | Exceptional 8.1% |