Brazilian vs Immigrants from Argentina Family Poverty
COMPARE
Brazilian
Immigrants from Argentina
Family Poverty
Family Poverty Comparison
Brazilians
Immigrants from Argentina
8.6%
FAMILY POVERTY
80.1/ 100
METRIC RATING
151st/ 347
METRIC RANK
8.4%
FAMILY POVERTY
88.2/ 100
METRIC RATING
132nd/ 347
METRIC RANK
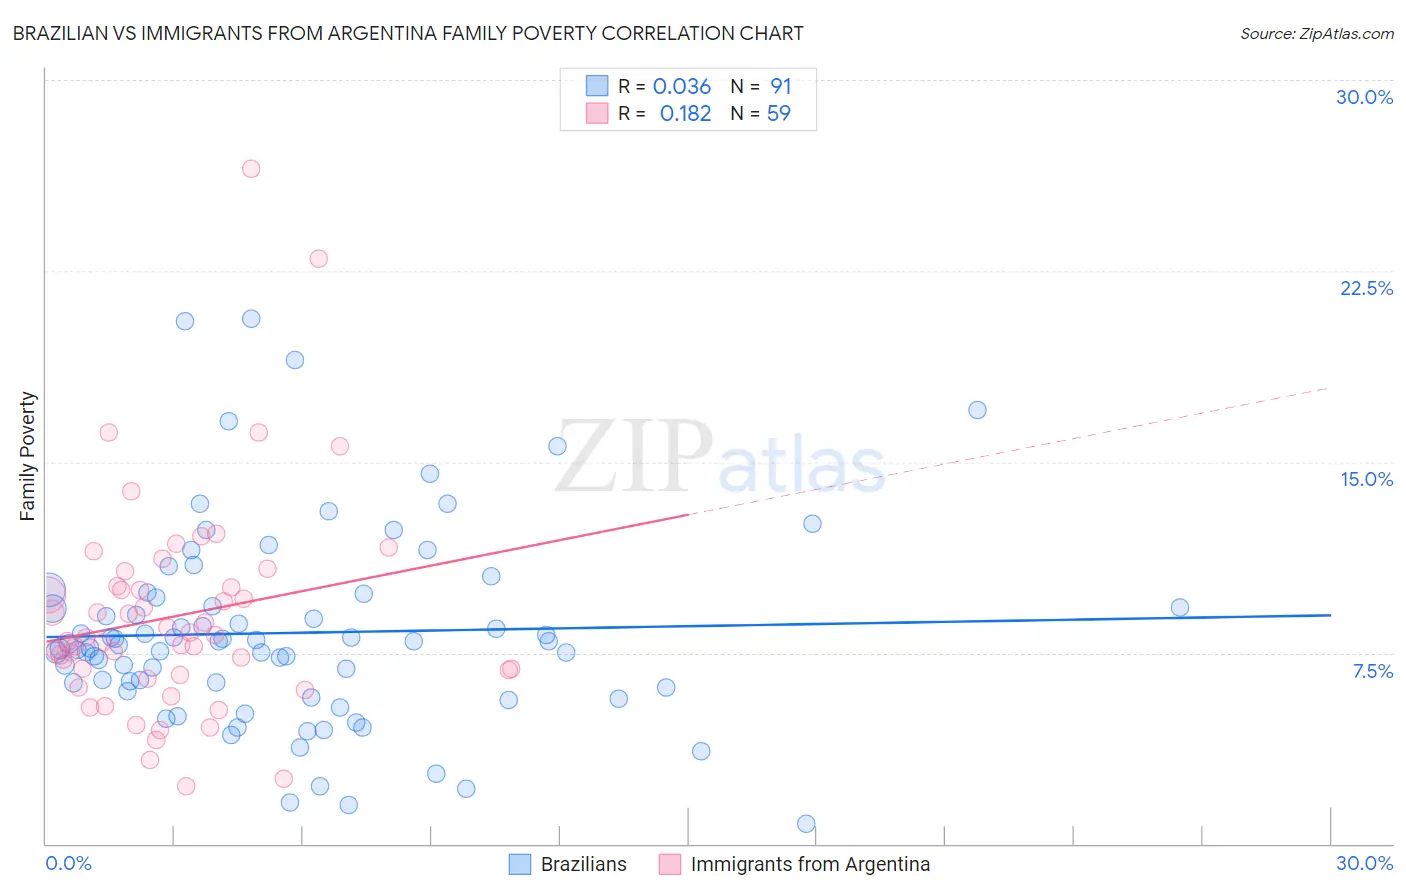
Brazilian vs Immigrants from Argentina Family Poverty Correlation Chart
The statistical analysis conducted on geographies consisting of 323,153,944 people shows no correlation between the proportion of Brazilians and poverty level among families in the United States with a correlation coefficient (R) of 0.036 and weighted average of 8.6%. Similarly, the statistical analysis conducted on geographies consisting of 264,069,938 people shows a poor positive correlation between the proportion of Immigrants from Argentina and poverty level among families in the United States with a correlation coefficient (R) of 0.182 and weighted average of 8.4%, a difference of 2.2%.
Family Poverty Correlation Summary
| Measurement | Brazilian | Immigrants from Argentina |
| Minimum | 0.81% | 2.3% |
| Maximum | 20.6% | 26.5% |
| Range | 19.8% | 24.3% |
| Mean | 8.3% | 8.9% |
| Median | 7.9% | 8.1% |
| Interquartile 25% (IQ1) | 6.2% | 6.6% |
| Interquartile 75% (IQ3) | 9.7% | 10.1% |
| Interquartile Range (IQR) | 3.5% | 3.5% |
| Standard Deviation (Sample) | 3.8% | 4.3% |
| Standard Deviation (Population) | 3.8% | 4.2% |
Demographics Similar to Brazilians and Immigrants from Argentina by Family Poverty
In terms of family poverty, the demographic groups most similar to Brazilians are Mongolian (8.6%, a difference of 0.050%), Syrian (8.6%, a difference of 0.050%), Scotch-Irish (8.6%, a difference of 0.45%), Immigrants from Jordan (8.5%, a difference of 0.66%), and Immigrants from Belarus (8.5%, a difference of 0.70%). Similarly, the demographic groups most similar to Immigrants from Argentina are Puget Sound Salish (8.4%, a difference of 0.15%), Sri Lankan (8.5%, a difference of 0.50%), Chilean (8.5%, a difference of 0.51%), Immigrants from Malaysia (8.5%, a difference of 0.55%), and Immigrants from Brazil (8.5%, a difference of 0.59%).
| Demographics | Rating | Rank | Family Poverty |
| Puget Sound Salish | 88.6 /100 | #131 | Excellent 8.4% |
| Immigrants | Argentina | 88.2 /100 | #132 | Excellent 8.4% |
| Sri Lankans | 86.6 /100 | #133 | Excellent 8.5% |
| Chileans | 86.6 /100 | #134 | Excellent 8.5% |
| Immigrants | Malaysia | 86.5 /100 | #135 | Excellent 8.5% |
| Immigrants | Brazil | 86.3 /100 | #136 | Excellent 8.5% |
| Immigrants | Southern Europe | 86.0 /100 | #137 | Excellent 8.5% |
| Armenians | 84.6 /100 | #138 | Excellent 8.5% |
| Immigrants | Nepal | 84.2 /100 | #139 | Excellent 8.5% |
| Immigrants | Kazakhstan | 84.1 /100 | #140 | Excellent 8.5% |
| Immigrants | Ukraine | 83.9 /100 | #141 | Excellent 8.5% |
| Yugoslavians | 83.5 /100 | #142 | Excellent 8.5% |
| Immigrants | Germany | 83.3 /100 | #143 | Excellent 8.5% |
| Albanians | 83.3 /100 | #144 | Excellent 8.5% |
| Immigrants | South Eastern Asia | 83.2 /100 | #145 | Excellent 8.5% |
| Immigrants | Belarus | 83.2 /100 | #146 | Excellent 8.5% |
| Immigrants | Jordan | 83.0 /100 | #147 | Excellent 8.5% |
| Scotch-Irish | 82.2 /100 | #148 | Excellent 8.6% |
| Mongolians | 80.4 /100 | #149 | Excellent 8.6% |
| Syrians | 80.3 /100 | #150 | Excellent 8.6% |
| Brazilians | 80.1 /100 | #151 | Excellent 8.6% |