Romanian vs British Family Poverty
COMPARE
Romanian
British
Family Poverty
Family Poverty Comparison
Romanians
British
8.2%
FAMILY POVERTY
94.7/ 100
METRIC RATING
110th/ 347
METRIC RANK
7.9%
FAMILY POVERTY
97.5/ 100
METRIC RATING
84th/ 347
METRIC RANK
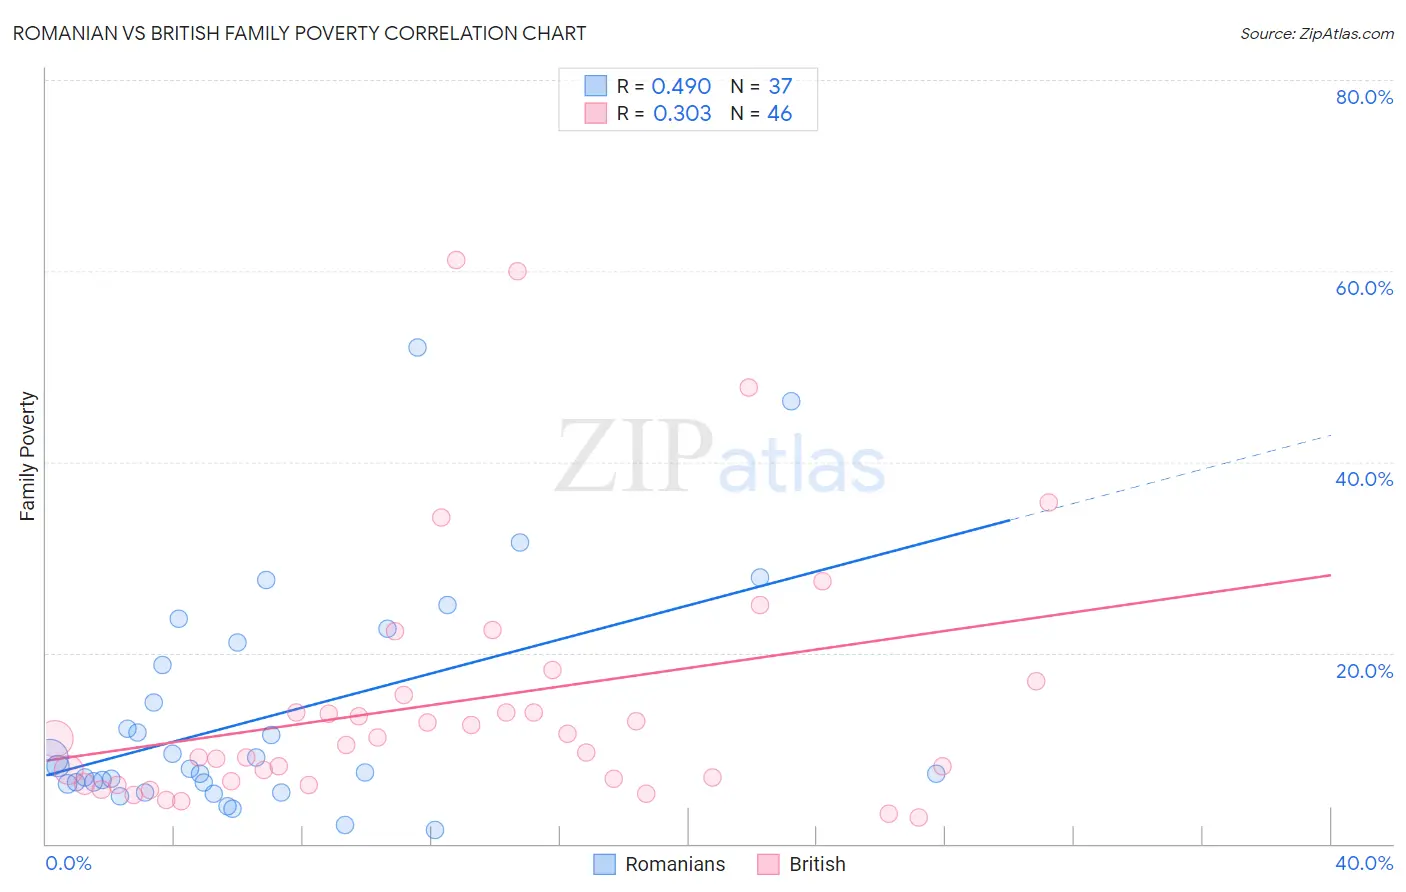
Romanian vs British Family Poverty Correlation Chart
The statistical analysis conducted on geographies consisting of 376,889,400 people shows a moderate positive correlation between the proportion of Romanians and poverty level among families in the United States with a correlation coefficient (R) of 0.490 and weighted average of 8.2%. Similarly, the statistical analysis conducted on geographies consisting of 528,449,567 people shows a mild positive correlation between the proportion of British and poverty level among families in the United States with a correlation coefficient (R) of 0.303 and weighted average of 7.9%, a difference of 3.0%.
Family Poverty Correlation Summary
| Measurement | Romanian | British |
| Minimum | 1.4% | 2.7% |
| Maximum | 52.0% | 61.1% |
| Range | 50.6% | 58.4% |
| Mean | 13.2% | 14.8% |
| Median | 7.9% | 10.6% |
| Interquartile 25% (IQ1) | 6.4% | 6.6% |
| Interquartile 75% (IQ3) | 19.9% | 15.5% |
| Interquartile Range (IQR) | 13.5% | 9.0% |
| Standard Deviation (Sample) | 11.8% | 13.5% |
| Standard Deviation (Population) | 11.6% | 13.3% |
Similar Demographics by Family Poverty
Demographics Similar to Romanians by Family Poverty
In terms of family poverty, the demographic groups most similar to Romanians are Taiwanese (8.2%, a difference of 0.060%), Jordanian (8.2%, a difference of 0.090%), Immigrants from France (8.2%, a difference of 0.16%), Basque (8.1%, a difference of 0.18%), and French Canadian (8.1%, a difference of 0.27%).
| Demographics | Rating | Rank | Family Poverty |
| Immigrants | Eastern Europe | 95.6 /100 | #103 | Exceptional 8.1% |
| Slavs | 95.6 /100 | #104 | Exceptional 8.1% |
| Laotians | 95.6 /100 | #105 | Exceptional 8.1% |
| Egyptians | 95.1 /100 | #106 | Exceptional 8.1% |
| French Canadians | 95.0 /100 | #107 | Exceptional 8.1% |
| Basques | 94.9 /100 | #108 | Exceptional 8.1% |
| Jordanians | 94.8 /100 | #109 | Exceptional 8.2% |
| Romanians | 94.7 /100 | #110 | Exceptional 8.2% |
| Taiwanese | 94.6 /100 | #111 | Exceptional 8.2% |
| Immigrants | France | 94.4 /100 | #112 | Exceptional 8.2% |
| Canadians | 94.2 /100 | #113 | Exceptional 8.2% |
| Immigrants | Zimbabwe | 94.0 /100 | #114 | Exceptional 8.2% |
| Immigrants | Israel | 93.5 /100 | #115 | Exceptional 8.2% |
| South Africans | 93.4 /100 | #116 | Exceptional 8.2% |
| Immigrants | Russia | 93.2 /100 | #117 | Exceptional 8.2% |
Demographics Similar to British by Family Poverty
In terms of family poverty, the demographic groups most similar to British are Slovak (7.9%, a difference of 0.24%), Immigrants from Asia (7.9%, a difference of 0.24%), Scottish (7.9%, a difference of 0.29%), Belgian (8.0%, a difference of 0.37%), and Immigrants from Poland (7.9%, a difference of 0.42%).
| Demographics | Rating | Rank | Family Poverty |
| Ukrainians | 98.0 /100 | #77 | Exceptional 7.9% |
| Immigrants | North America | 97.9 /100 | #78 | Exceptional 7.9% |
| Immigrants | Europe | 97.8 /100 | #79 | Exceptional 7.9% |
| English | 97.8 /100 | #80 | Exceptional 7.9% |
| Irish | 97.8 /100 | #81 | Exceptional 7.9% |
| Immigrants | Poland | 97.8 /100 | #82 | Exceptional 7.9% |
| Slovaks | 97.7 /100 | #83 | Exceptional 7.9% |
| British | 97.5 /100 | #84 | Exceptional 7.9% |
| Immigrants | Asia | 97.4 /100 | #85 | Exceptional 7.9% |
| Scottish | 97.3 /100 | #86 | Exceptional 7.9% |
| Belgians | 97.3 /100 | #87 | Exceptional 8.0% |
| Serbians | 97.2 /100 | #88 | Exceptional 8.0% |
| Immigrants | Denmark | 97.1 /100 | #89 | Exceptional 8.0% |
| Immigrants | England | 97.1 /100 | #90 | Exceptional 8.0% |
| Immigrants | Italy | 97.0 /100 | #91 | Exceptional 8.0% |