Immigrants from Taiwan vs British Family Poverty
COMPARE
Immigrants from Taiwan
British
Family Poverty
Family Poverty Comparison
Immigrants from Taiwan
British
6.6%
FAMILY POVERTY
100.0/ 100
METRIC RATING
3rd/ 347
METRIC RANK
7.9%
FAMILY POVERTY
97.5/ 100
METRIC RATING
84th/ 347
METRIC RANK
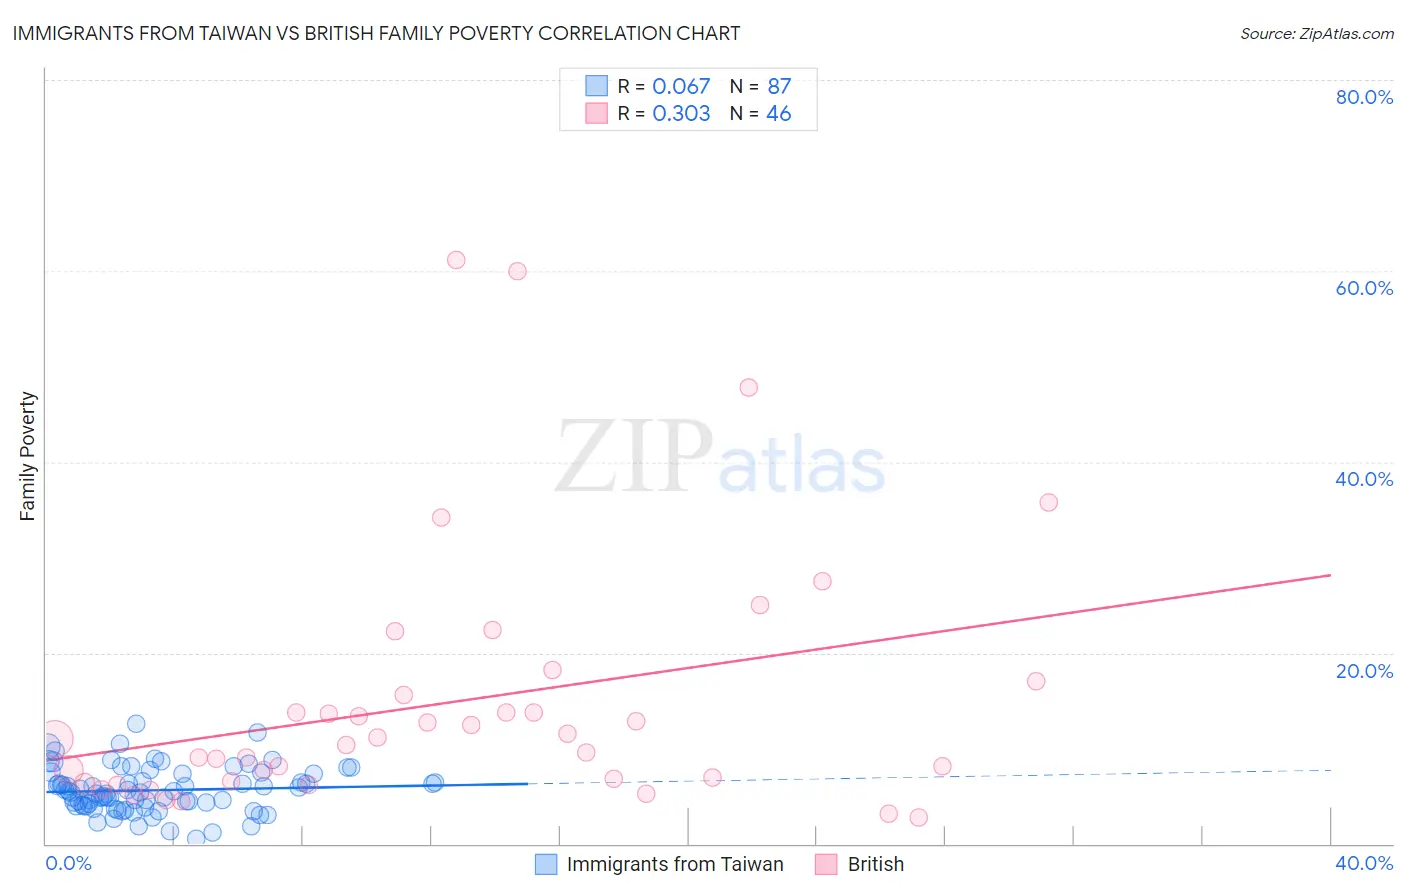
Immigrants from Taiwan vs British Family Poverty Correlation Chart
The statistical analysis conducted on geographies consisting of 297,599,094 people shows a slight positive correlation between the proportion of Immigrants from Taiwan and poverty level among families in the United States with a correlation coefficient (R) of 0.067 and weighted average of 6.6%. Similarly, the statistical analysis conducted on geographies consisting of 528,449,567 people shows a mild positive correlation between the proportion of British and poverty level among families in the United States with a correlation coefficient (R) of 0.303 and weighted average of 7.9%, a difference of 19.9%.
Family Poverty Correlation Summary
| Measurement | Immigrants from Taiwan | British |
| Minimum | 0.55% | 2.7% |
| Maximum | 12.6% | 61.1% |
| Range | 12.0% | 58.4% |
| Mean | 5.6% | 14.8% |
| Median | 5.4% | 10.6% |
| Interquartile 25% (IQ1) | 4.0% | 6.6% |
| Interquartile 75% (IQ3) | 7.3% | 15.5% |
| Interquartile Range (IQR) | 3.4% | 9.0% |
| Standard Deviation (Sample) | 2.3% | 13.5% |
| Standard Deviation (Population) | 2.3% | 13.3% |
Similar Demographics by Family Poverty
Demographics Similar to Immigrants from Taiwan by Family Poverty
In terms of family poverty, the demographic groups most similar to Immigrants from Taiwan are Filipino (6.6%, a difference of 0.61%), Thai (6.7%, a difference of 1.2%), Chinese (6.5%, a difference of 1.6%), Norwegian (6.9%, a difference of 4.3%), and Immigrants from Ireland (7.0%, a difference of 5.7%).
| Demographics | Rating | Rank | Family Poverty |
| Immigrants | India | 100.0 /100 | #1 | Exceptional 6.2% |
| Chinese | 100.0 /100 | #2 | Exceptional 6.5% |
| Immigrants | Taiwan | 100.0 /100 | #3 | Exceptional 6.6% |
| Filipinos | 100.0 /100 | #4 | Exceptional 6.6% |
| Thais | 100.0 /100 | #5 | Exceptional 6.7% |
| Norwegians | 99.9 /100 | #6 | Exceptional 6.9% |
| Immigrants | Ireland | 99.9 /100 | #7 | Exceptional 7.0% |
| Bhutanese | 99.9 /100 | #8 | Exceptional 7.0% |
| Latvians | 99.9 /100 | #9 | Exceptional 7.1% |
| Bulgarians | 99.8 /100 | #10 | Exceptional 7.1% |
| Immigrants | Singapore | 99.8 /100 | #11 | Exceptional 7.1% |
| Maltese | 99.8 /100 | #12 | Exceptional 7.1% |
| Swedes | 99.8 /100 | #13 | Exceptional 7.1% |
| Iranians | 99.8 /100 | #14 | Exceptional 7.1% |
| Lithuanians | 99.8 /100 | #15 | Exceptional 7.2% |
Demographics Similar to British by Family Poverty
In terms of family poverty, the demographic groups most similar to British are Slovak (7.9%, a difference of 0.24%), Immigrants from Asia (7.9%, a difference of 0.24%), Scottish (7.9%, a difference of 0.29%), Belgian (8.0%, a difference of 0.37%), and Immigrants from Poland (7.9%, a difference of 0.42%).
| Demographics | Rating | Rank | Family Poverty |
| Ukrainians | 98.0 /100 | #77 | Exceptional 7.9% |
| Immigrants | North America | 97.9 /100 | #78 | Exceptional 7.9% |
| Immigrants | Europe | 97.8 /100 | #79 | Exceptional 7.9% |
| English | 97.8 /100 | #80 | Exceptional 7.9% |
| Irish | 97.8 /100 | #81 | Exceptional 7.9% |
| Immigrants | Poland | 97.8 /100 | #82 | Exceptional 7.9% |
| Slovaks | 97.7 /100 | #83 | Exceptional 7.9% |
| British | 97.5 /100 | #84 | Exceptional 7.9% |
| Immigrants | Asia | 97.4 /100 | #85 | Exceptional 7.9% |
| Scottish | 97.3 /100 | #86 | Exceptional 7.9% |
| Belgians | 97.3 /100 | #87 | Exceptional 8.0% |
| Serbians | 97.2 /100 | #88 | Exceptional 8.0% |
| Immigrants | Denmark | 97.1 /100 | #89 | Exceptional 8.0% |
| Immigrants | England | 97.1 /100 | #90 | Exceptional 8.0% |
| Immigrants | Italy | 97.0 /100 | #91 | Exceptional 8.0% |