Immigrants from Bulgaria vs British Family Poverty
COMPARE
Immigrants from Bulgaria
British
Family Poverty
Family Poverty Comparison
Immigrants from Bulgaria
British
7.8%
FAMILY POVERTY
98.3/ 100
METRIC RATING
65th/ 347
METRIC RANK
7.9%
FAMILY POVERTY
97.5/ 100
METRIC RATING
84th/ 347
METRIC RANK
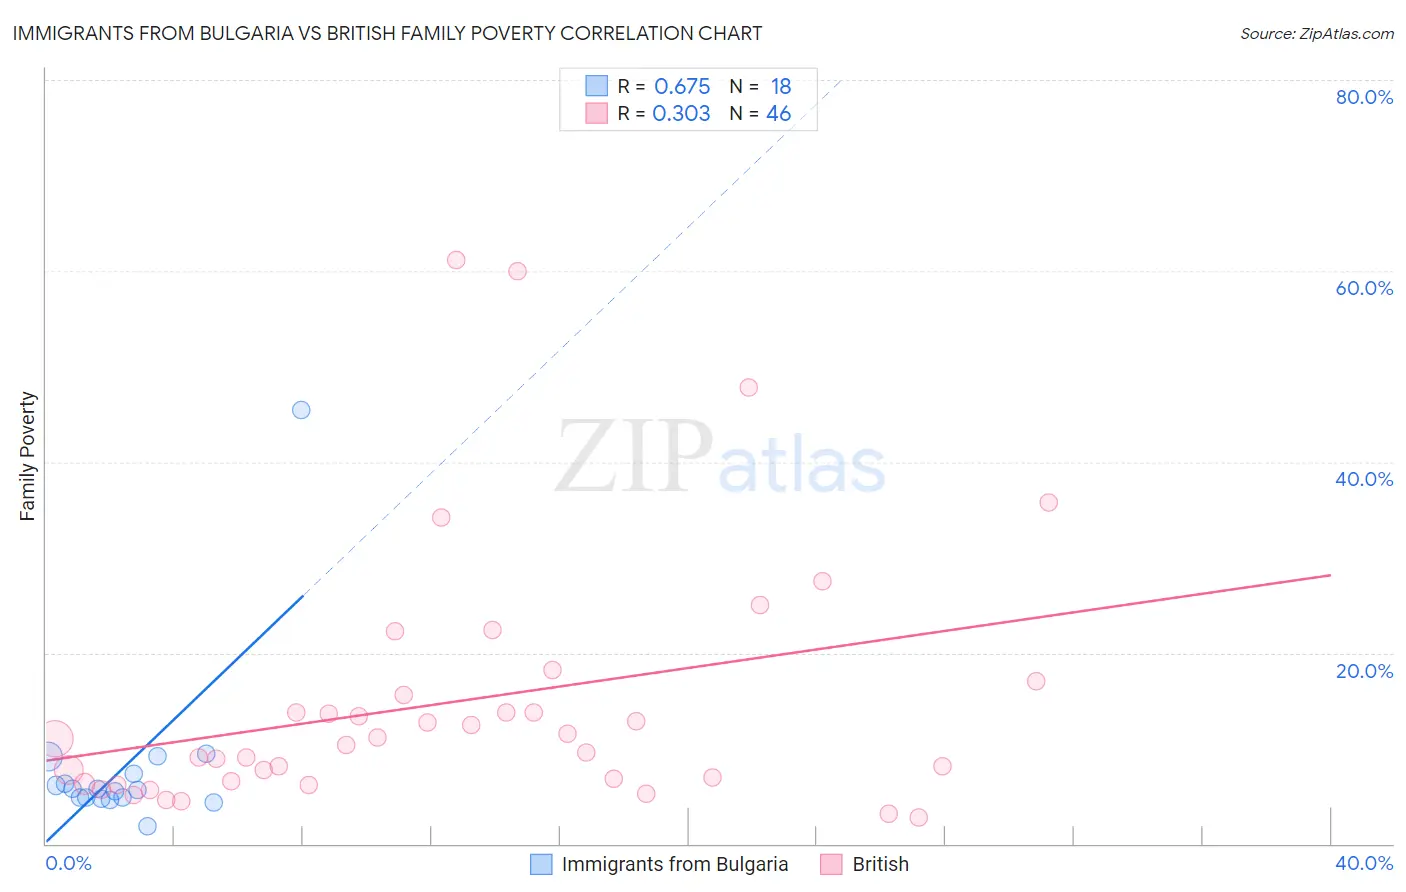
Immigrants from Bulgaria vs British Family Poverty Correlation Chart
The statistical analysis conducted on geographies consisting of 172,392,882 people shows a significant positive correlation between the proportion of Immigrants from Bulgaria and poverty level among families in the United States with a correlation coefficient (R) of 0.675 and weighted average of 7.8%. Similarly, the statistical analysis conducted on geographies consisting of 528,449,567 people shows a mild positive correlation between the proportion of British and poverty level among families in the United States with a correlation coefficient (R) of 0.303 and weighted average of 7.9%, a difference of 1.4%.
Family Poverty Correlation Summary
| Measurement | Immigrants from Bulgaria | British |
| Minimum | 1.9% | 2.7% |
| Maximum | 45.5% | 61.1% |
| Range | 43.6% | 58.4% |
| Mean | 8.1% | 14.8% |
| Median | 5.7% | 10.6% |
| Interquartile 25% (IQ1) | 4.8% | 6.6% |
| Interquartile 75% (IQ3) | 7.3% | 15.5% |
| Interquartile Range (IQR) | 2.5% | 9.0% |
| Standard Deviation (Sample) | 9.5% | 13.5% |
| Standard Deviation (Population) | 9.2% | 13.3% |
Demographics Similar to Immigrants from Bulgaria and British by Family Poverty
In terms of family poverty, the demographic groups most similar to Immigrants from Bulgaria are Korean (7.8%, a difference of 0.010%), Dutch (7.8%, a difference of 0.060%), Northern European (7.8%, a difference of 0.070%), Australian (7.8%, a difference of 0.11%), and Immigrants from Belgium (7.8%, a difference of 0.12%). Similarly, the demographic groups most similar to British are Slovak (7.9%, a difference of 0.24%), Immigrants from Poland (7.9%, a difference of 0.42%), Irish (7.9%, a difference of 0.45%), English (7.9%, a difference of 0.46%), and Immigrants from Europe (7.9%, a difference of 0.52%).
| Demographics | Rating | Rank | Family Poverty |
| Koreans | 98.3 /100 | #64 | Exceptional 7.8% |
| Immigrants | Bulgaria | 98.3 /100 | #65 | Exceptional 7.8% |
| Dutch | 98.3 /100 | #66 | Exceptional 7.8% |
| Northern Europeans | 98.3 /100 | #67 | Exceptional 7.8% |
| Australians | 98.2 /100 | #68 | Exceptional 7.8% |
| Immigrants | Belgium | 98.2 /100 | #69 | Exceptional 7.8% |
| Immigrants | Canada | 98.2 /100 | #70 | Exceptional 7.8% |
| Cambodians | 98.2 /100 | #71 | Exceptional 7.8% |
| Immigrants | Romania | 98.2 /100 | #72 | Exceptional 7.8% |
| Austrians | 98.2 /100 | #73 | Exceptional 7.8% |
| Immigrants | China | 98.1 /100 | #74 | Exceptional 7.8% |
| Immigrants | Croatia | 98.1 /100 | #75 | Exceptional 7.8% |
| Immigrants | Latvia | 98.0 /100 | #76 | Exceptional 7.9% |
| Ukrainians | 98.0 /100 | #77 | Exceptional 7.9% |
| Immigrants | North America | 97.9 /100 | #78 | Exceptional 7.9% |
| Immigrants | Europe | 97.8 /100 | #79 | Exceptional 7.9% |
| English | 97.8 /100 | #80 | Exceptional 7.9% |
| Irish | 97.8 /100 | #81 | Exceptional 7.9% |
| Immigrants | Poland | 97.8 /100 | #82 | Exceptional 7.9% |
| Slovaks | 97.7 /100 | #83 | Exceptional 7.9% |
| British | 97.5 /100 | #84 | Exceptional 7.9% |