Black/African American vs Immigrants from Canada Divorced or Separated
COMPARE
Black/African American
Immigrants from Canada
Divorced or Separated
Divorced or Separated Comparison
Blacks/African Americans
Immigrants from Canada
13.6%
DIVORCED OR SEPARATED
0.0/ 100
METRIC RATING
331st/ 347
METRIC RANK
12.1%
DIVORCED OR SEPARATED
44.0/ 100
METRIC RATING
181st/ 347
METRIC RANK
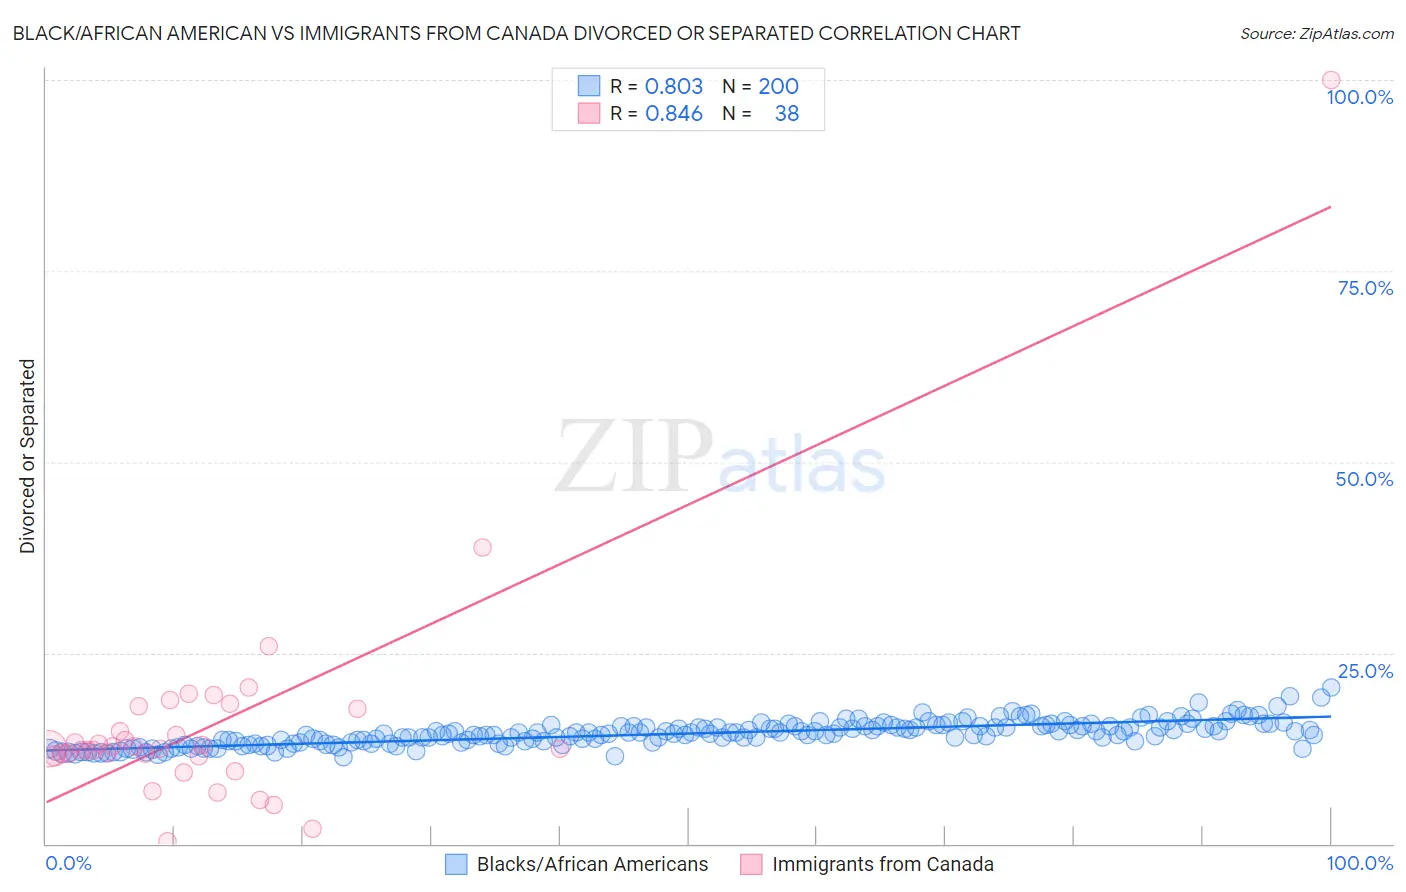
Black/African American vs Immigrants from Canada Divorced or Separated Correlation Chart
The statistical analysis conducted on geographies consisting of 565,552,203 people shows a very strong positive correlation between the proportion of Blacks/African Americans and percentage of population currently divorced or separated in the United States with a correlation coefficient (R) of 0.803 and weighted average of 13.6%. Similarly, the statistical analysis conducted on geographies consisting of 459,212,003 people shows a very strong positive correlation between the proportion of Immigrants from Canada and percentage of population currently divorced or separated in the United States with a correlation coefficient (R) of 0.846 and weighted average of 12.1%, a difference of 12.8%.
Divorced or Separated Correlation Summary
| Measurement | Black/African American | Immigrants from Canada |
| Minimum | 11.4% | 0.33% |
| Maximum | 20.4% | 100.0% |
| Range | 9.1% | 99.7% |
| Mean | 14.4% | 15.6% |
| Median | 14.4% | 12.5% |
| Interquartile 25% (IQ1) | 13.2% | 11.5% |
| Interquartile 75% (IQ3) | 15.4% | 17.6% |
| Interquartile Range (IQR) | 2.2% | 6.1% |
| Standard Deviation (Sample) | 1.6% | 15.5% |
| Standard Deviation (Population) | 1.6% | 15.3% |
Similar Demographics by Divorced or Separated
Demographics Similar to Blacks/African Americans by Divorced or Separated
In terms of divorced or separated, the demographic groups most similar to Blacks/African Americans are Paiute (13.6%, a difference of 0.13%), Houma (13.6%, a difference of 0.24%), Immigrants from Caribbean (13.6%, a difference of 0.39%), Cherokee (13.7%, a difference of 0.76%), and Comanche (13.5%, a difference of 0.77%).
| Demographics | Rating | Rank | Divorced or Separated |
| Osage | 0.0 /100 | #324 | Tragic 13.4% |
| Potawatomi | 0.0 /100 | #325 | Tragic 13.5% |
| Immigrants | Congo | 0.0 /100 | #326 | Tragic 13.5% |
| Comanche | 0.0 /100 | #327 | Tragic 13.5% |
| Immigrants | Caribbean | 0.0 /100 | #328 | Tragic 13.6% |
| Houma | 0.0 /100 | #329 | Tragic 13.6% |
| Paiute | 0.0 /100 | #330 | Tragic 13.6% |
| Blacks/African Americans | 0.0 /100 | #331 | Tragic 13.6% |
| Cherokee | 0.0 /100 | #332 | Tragic 13.7% |
| Puerto Ricans | 0.0 /100 | #333 | Tragic 13.9% |
| Immigrants | Bahamas | 0.0 /100 | #334 | Tragic 13.9% |
| Dutch West Indians | 0.0 /100 | #335 | Tragic 14.0% |
| Shoshone | 0.0 /100 | #336 | Tragic 14.0% |
| Crow | 0.0 /100 | #337 | Tragic 14.1% |
| Choctaw | 0.0 /100 | #338 | Tragic 14.1% |
Demographics Similar to Immigrants from Canada by Divorced or Separated
In terms of divorced or separated, the demographic groups most similar to Immigrants from Canada are Barbadian (12.1%, a difference of 0.030%), Immigrants from Ethiopia (12.1%, a difference of 0.030%), Immigrants from Central America (12.1%, a difference of 0.040%), Immigrants from Western Europe (12.1%, a difference of 0.050%), and Ghanaian (12.1%, a difference of 0.060%).
| Demographics | Rating | Rank | Divorced or Separated |
| Hawaiians | 50.0 /100 | #174 | Average 12.1% |
| Immigrants | Sierra Leone | 50.0 /100 | #175 | Average 12.1% |
| Pennsylvania Germans | 48.9 /100 | #176 | Average 12.1% |
| Brazilians | 47.7 /100 | #177 | Average 12.1% |
| Ghanaians | 45.9 /100 | #178 | Average 12.1% |
| Immigrants | Western Europe | 45.6 /100 | #179 | Average 12.1% |
| Barbadians | 45.0 /100 | #180 | Average 12.1% |
| Immigrants | Canada | 44.0 /100 | #181 | Average 12.1% |
| Immigrants | Ethiopia | 43.1 /100 | #182 | Average 12.1% |
| Immigrants | Central America | 42.9 /100 | #183 | Average 12.1% |
| Immigrants | North America | 41.1 /100 | #184 | Average 12.1% |
| Immigrants | Nigeria | 40.5 /100 | #185 | Average 12.1% |
| Immigrants | Chile | 39.0 /100 | #186 | Fair 12.1% |
| Belizeans | 37.7 /100 | #187 | Fair 12.1% |
| Immigrants | Belize | 37.6 /100 | #188 | Fair 12.1% |