Bhutanese vs Immigrants from Eastern Asia Female Poverty
COMPARE
Bhutanese
Immigrants from Eastern Asia
Female Poverty
Female Poverty Comparison
Bhutanese
Immigrants from Eastern Asia
11.3%
FEMALE POVERTY
99.9/ 100
METRIC RATING
12th/ 347
METRIC RANK
12.2%
FEMALE POVERTY
97.8/ 100
METRIC RATING
67th/ 347
METRIC RANK
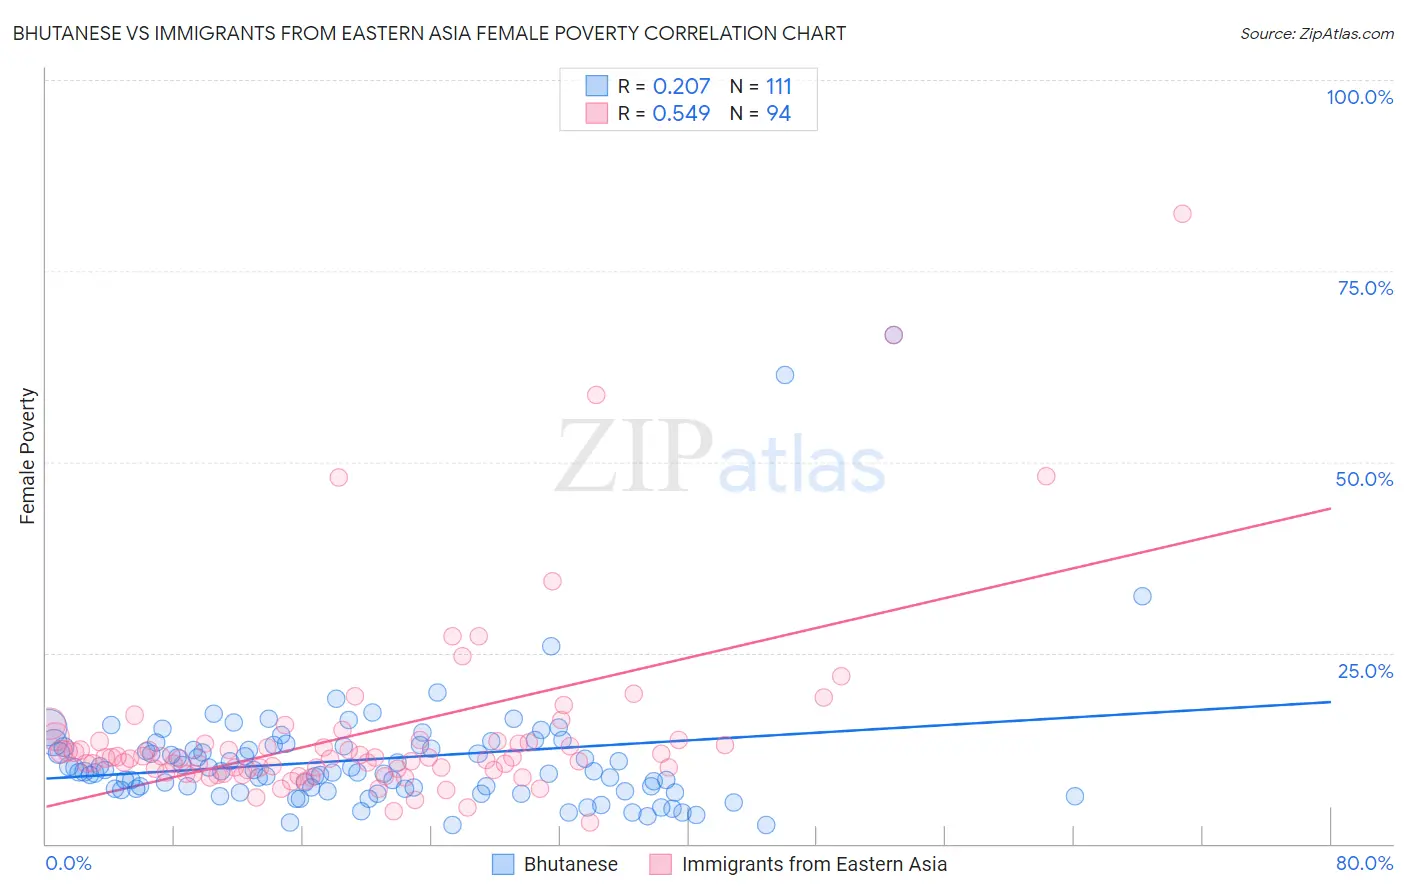
Bhutanese vs Immigrants from Eastern Asia Female Poverty Correlation Chart
The statistical analysis conducted on geographies consisting of 455,052,143 people shows a weak positive correlation between the proportion of Bhutanese and poverty level among females in the United States with a correlation coefficient (R) of 0.207 and weighted average of 11.3%. Similarly, the statistical analysis conducted on geographies consisting of 499,182,216 people shows a substantial positive correlation between the proportion of Immigrants from Eastern Asia and poverty level among females in the United States with a correlation coefficient (R) of 0.549 and weighted average of 12.2%, a difference of 8.2%.
Female Poverty Correlation Summary
| Measurement | Bhutanese | Immigrants from Eastern Asia |
| Minimum | 2.5% | 2.9% |
| Maximum | 66.7% | 82.5% |
| Range | 64.2% | 79.7% |
| Mean | 11.1% | 14.5% |
| Median | 9.4% | 11.3% |
| Interquartile 25% (IQ1) | 7.2% | 9.7% |
| Interquartile 75% (IQ3) | 12.7% | 13.5% |
| Interquartile Range (IQR) | 5.6% | 3.8% |
| Standard Deviation (Sample) | 8.5% | 12.4% |
| Standard Deviation (Population) | 8.5% | 12.3% |
Similar Demographics by Female Poverty
Demographics Similar to Bhutanese by Female Poverty
In terms of female poverty, the demographic groups most similar to Bhutanese are Immigrants from Lithuania (11.3%, a difference of 0.010%), Maltese (11.2%, a difference of 0.46%), Immigrants from Hong Kong (11.2%, a difference of 0.57%), Lithuanian (11.4%, a difference of 0.97%), and Latvian (11.4%, a difference of 1.3%).
| Demographics | Rating | Rank | Female Poverty |
| Filipinos | 100.0 /100 | #5 | Exceptional 10.9% |
| Immigrants | Ireland | 99.9 /100 | #6 | Exceptional 11.0% |
| Assyrians/Chaldeans/Syriacs | 99.9 /100 | #7 | Exceptional 11.0% |
| Immigrants | South Central Asia | 99.9 /100 | #8 | Exceptional 11.1% |
| Bulgarians | 99.9 /100 | #9 | Exceptional 11.1% |
| Immigrants | Hong Kong | 99.9 /100 | #10 | Exceptional 11.2% |
| Maltese | 99.9 /100 | #11 | Exceptional 11.2% |
| Bhutanese | 99.9 /100 | #12 | Exceptional 11.3% |
| Immigrants | Lithuania | 99.9 /100 | #13 | Exceptional 11.3% |
| Lithuanians | 99.8 /100 | #14 | Exceptional 11.4% |
| Latvians | 99.8 /100 | #15 | Exceptional 11.4% |
| Immigrants | Bolivia | 99.8 /100 | #16 | Exceptional 11.5% |
| Bolivians | 99.8 /100 | #17 | Exceptional 11.5% |
| Immigrants | Scotland | 99.8 /100 | #18 | Exceptional 11.5% |
| Norwegians | 99.8 /100 | #19 | Exceptional 11.5% |
Demographics Similar to Immigrants from Eastern Asia by Female Poverty
In terms of female poverty, the demographic groups most similar to Immigrants from Eastern Asia are Immigrants from Netherlands (12.2%, a difference of 0.040%), Austrian (12.2%, a difference of 0.13%), Indian (Asian) (12.2%, a difference of 0.14%), Swiss (12.2%, a difference of 0.14%), and German (12.2%, a difference of 0.17%).
| Demographics | Rating | Rank | Female Poverty |
| Immigrants | Australia | 98.1 /100 | #60 | Exceptional 12.2% |
| Immigrants | Asia | 98.1 /100 | #61 | Exceptional 12.2% |
| Immigrants | Italy | 98.0 /100 | #62 | Exceptional 12.2% |
| Ukrainians | 98.0 /100 | #63 | Exceptional 12.2% |
| Germans | 98.0 /100 | #64 | Exceptional 12.2% |
| Indians (Asian) | 97.9 /100 | #65 | Exceptional 12.2% |
| Austrians | 97.9 /100 | #66 | Exceptional 12.2% |
| Immigrants | Eastern Asia | 97.8 /100 | #67 | Exceptional 12.2% |
| Immigrants | Netherlands | 97.8 /100 | #68 | Exceptional 12.2% |
| Swiss | 97.7 /100 | #69 | Exceptional 12.2% |
| Immigrants | Belgium | 97.7 /100 | #70 | Exceptional 12.2% |
| Carpatho Rusyns | 97.6 /100 | #71 | Exceptional 12.2% |
| Cambodians | 97.5 /100 | #72 | Exceptional 12.2% |
| Zimbabweans | 97.5 /100 | #73 | Exceptional 12.3% |
| Immigrants | Canada | 97.5 /100 | #74 | Exceptional 12.3% |