Bhutanese vs Immigrants from Brazil Female Poverty
COMPARE
Bhutanese
Immigrants from Brazil
Female Poverty
Female Poverty Comparison
Bhutanese
Immigrants from Brazil
11.3%
FEMALE POVERTY
99.9/ 100
METRIC RATING
12th/ 347
METRIC RANK
12.8%
FEMALE POVERTY
87.9/ 100
METRIC RATING
129th/ 347
METRIC RANK
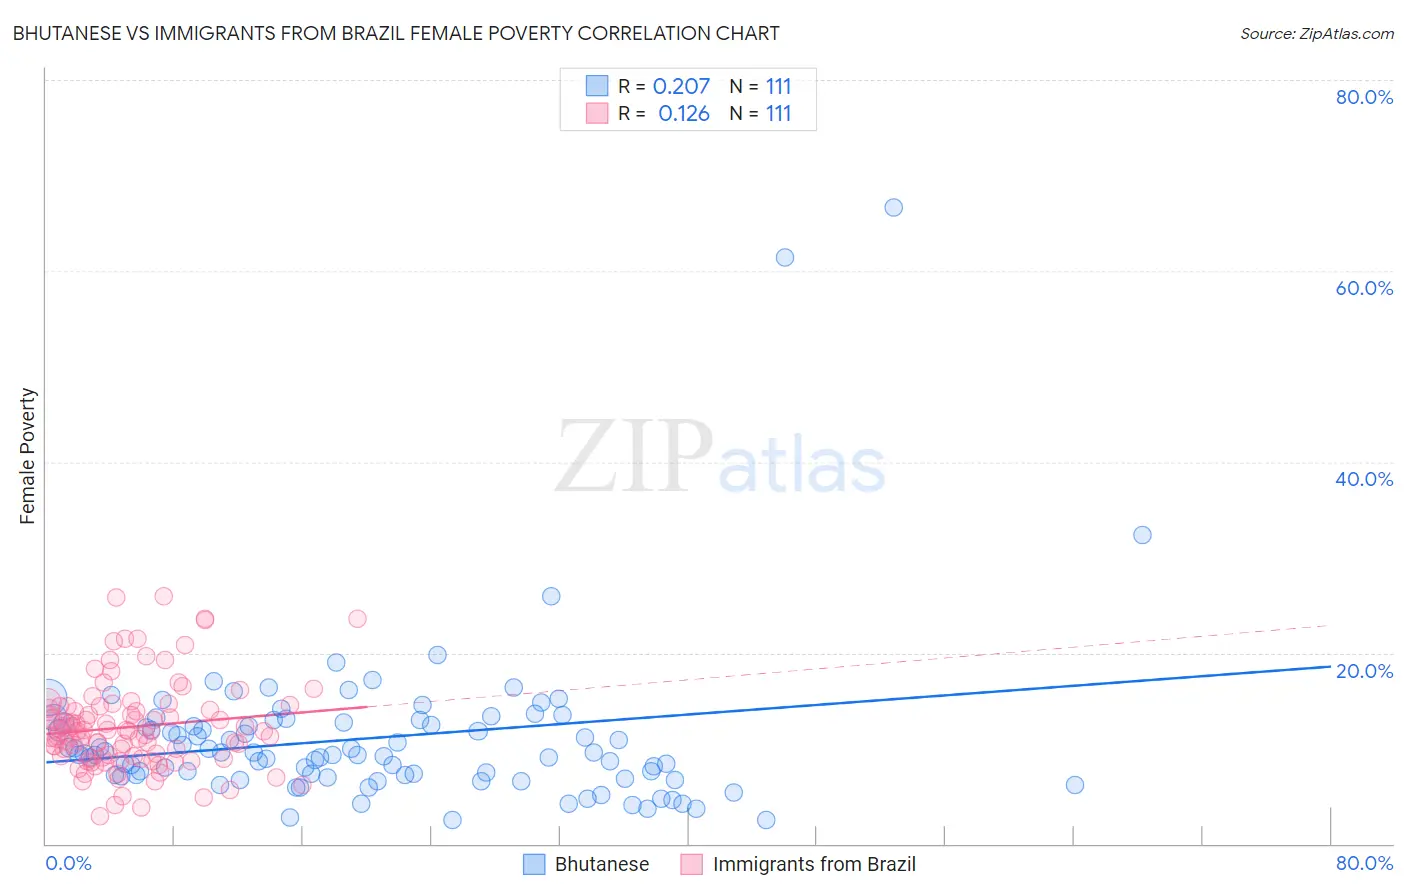
Bhutanese vs Immigrants from Brazil Female Poverty Correlation Chart
The statistical analysis conducted on geographies consisting of 455,052,143 people shows a weak positive correlation between the proportion of Bhutanese and poverty level among females in the United States with a correlation coefficient (R) of 0.207 and weighted average of 11.3%. Similarly, the statistical analysis conducted on geographies consisting of 342,799,416 people shows a poor positive correlation between the proportion of Immigrants from Brazil and poverty level among females in the United States with a correlation coefficient (R) of 0.126 and weighted average of 12.8%, a difference of 13.4%.
Female Poverty Correlation Summary
| Measurement | Bhutanese | Immigrants from Brazil |
| Minimum | 2.5% | 2.9% |
| Maximum | 66.7% | 25.9% |
| Range | 64.2% | 23.1% |
| Mean | 11.1% | 12.2% |
| Median | 9.4% | 11.8% |
| Interquartile 25% (IQ1) | 7.2% | 9.0% |
| Interquartile 75% (IQ3) | 12.7% | 14.5% |
| Interquartile Range (IQR) | 5.6% | 5.4% |
| Standard Deviation (Sample) | 8.5% | 4.6% |
| Standard Deviation (Population) | 8.5% | 4.6% |
Similar Demographics by Female Poverty
Demographics Similar to Bhutanese by Female Poverty
In terms of female poverty, the demographic groups most similar to Bhutanese are Immigrants from Lithuania (11.3%, a difference of 0.010%), Maltese (11.2%, a difference of 0.46%), Immigrants from Hong Kong (11.2%, a difference of 0.57%), Lithuanian (11.4%, a difference of 0.97%), and Latvian (11.4%, a difference of 1.3%).
| Demographics | Rating | Rank | Female Poverty |
| Filipinos | 100.0 /100 | #5 | Exceptional 10.9% |
| Immigrants | Ireland | 99.9 /100 | #6 | Exceptional 11.0% |
| Assyrians/Chaldeans/Syriacs | 99.9 /100 | #7 | Exceptional 11.0% |
| Immigrants | South Central Asia | 99.9 /100 | #8 | Exceptional 11.1% |
| Bulgarians | 99.9 /100 | #9 | Exceptional 11.1% |
| Immigrants | Hong Kong | 99.9 /100 | #10 | Exceptional 11.2% |
| Maltese | 99.9 /100 | #11 | Exceptional 11.2% |
| Bhutanese | 99.9 /100 | #12 | Exceptional 11.3% |
| Immigrants | Lithuania | 99.9 /100 | #13 | Exceptional 11.3% |
| Lithuanians | 99.8 /100 | #14 | Exceptional 11.4% |
| Latvians | 99.8 /100 | #15 | Exceptional 11.4% |
| Immigrants | Bolivia | 99.8 /100 | #16 | Exceptional 11.5% |
| Bolivians | 99.8 /100 | #17 | Exceptional 11.5% |
| Immigrants | Scotland | 99.8 /100 | #18 | Exceptional 11.5% |
| Norwegians | 99.8 /100 | #19 | Exceptional 11.5% |
Demographics Similar to Immigrants from Brazil by Female Poverty
In terms of female poverty, the demographic groups most similar to Immigrants from Brazil are Immigrants from Belarus (12.8%, a difference of 0.070%), South African (12.8%, a difference of 0.11%), Immigrants from Vietnam (12.8%, a difference of 0.19%), Immigrants from Ukraine (12.8%, a difference of 0.22%), and Immigrants from Argentina (12.8%, a difference of 0.22%).
| Demographics | Rating | Rank | Female Poverty |
| French Canadians | 90.2 /100 | #122 | Exceptional 12.7% |
| Immigrants | South Eastern Asia | 89.9 /100 | #123 | Excellent 12.7% |
| Immigrants | Norway | 89.3 /100 | #124 | Excellent 12.8% |
| Argentineans | 89.1 /100 | #125 | Excellent 12.8% |
| Immigrants | Ukraine | 88.8 /100 | #126 | Excellent 12.8% |
| South Africans | 88.4 /100 | #127 | Excellent 12.8% |
| Immigrants | Belarus | 88.2 /100 | #128 | Excellent 12.8% |
| Immigrants | Brazil | 87.9 /100 | #129 | Excellent 12.8% |
| Immigrants | Vietnam | 87.1 /100 | #130 | Excellent 12.8% |
| Immigrants | Argentina | 87.0 /100 | #131 | Excellent 12.8% |
| Immigrants | Jordan | 86.9 /100 | #132 | Excellent 12.8% |
| Immigrants | Western Europe | 86.6 /100 | #133 | Excellent 12.8% |
| Immigrants | Switzerland | 85.8 /100 | #134 | Excellent 12.9% |
| French | 85.6 /100 | #135 | Excellent 12.9% |
| Peruvians | 85.2 /100 | #136 | Excellent 12.9% |