Bhutanese vs Immigrants from Cuba Female Poverty
COMPARE
Bhutanese
Immigrants from Cuba
Female Poverty
Female Poverty Comparison
Bhutanese
Immigrants from Cuba
11.3%
FEMALE POVERTY
99.9/ 100
METRIC RATING
12th/ 347
METRIC RANK
16.1%
FEMALE POVERTY
0.0/ 100
METRIC RATING
283rd/ 347
METRIC RANK
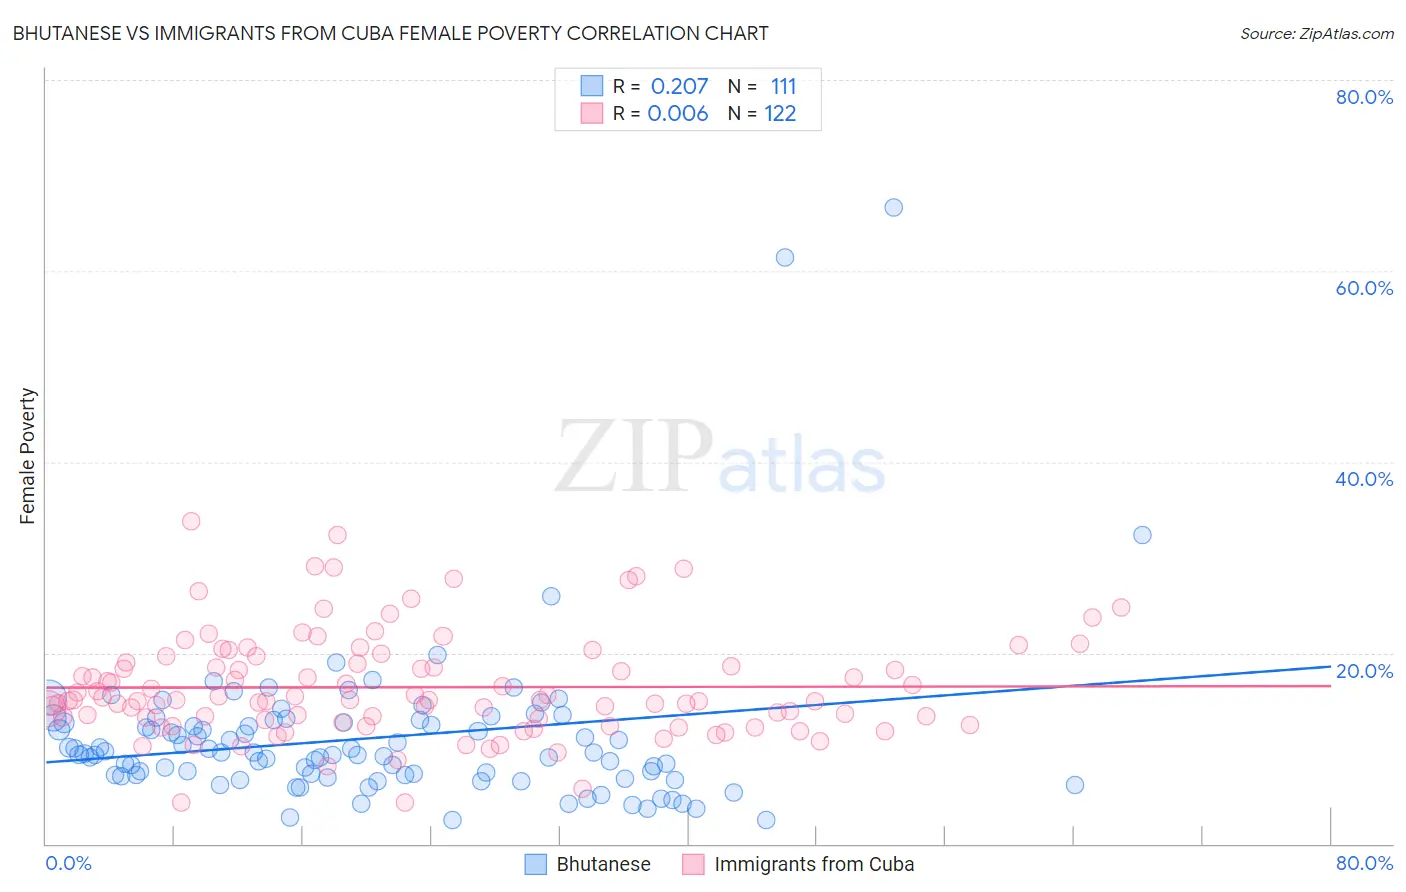
Bhutanese vs Immigrants from Cuba Female Poverty Correlation Chart
The statistical analysis conducted on geographies consisting of 455,052,143 people shows a weak positive correlation between the proportion of Bhutanese and poverty level among females in the United States with a correlation coefficient (R) of 0.207 and weighted average of 11.3%. Similarly, the statistical analysis conducted on geographies consisting of 325,939,480 people shows no correlation between the proportion of Immigrants from Cuba and poverty level among females in the United States with a correlation coefficient (R) of 0.006 and weighted average of 16.1%, a difference of 43.1%.
Female Poverty Correlation Summary
| Measurement | Bhutanese | Immigrants from Cuba |
| Minimum | 2.5% | 4.3% |
| Maximum | 66.7% | 33.8% |
| Range | 64.2% | 29.5% |
| Mean | 11.1% | 16.4% |
| Median | 9.4% | 15.0% |
| Interquartile 25% (IQ1) | 7.2% | 13.0% |
| Interquartile 75% (IQ3) | 12.7% | 19.0% |
| Interquartile Range (IQR) | 5.6% | 6.0% |
| Standard Deviation (Sample) | 8.5% | 5.5% |
| Standard Deviation (Population) | 8.5% | 5.4% |
Similar Demographics by Female Poverty
Demographics Similar to Bhutanese by Female Poverty
In terms of female poverty, the demographic groups most similar to Bhutanese are Immigrants from Lithuania (11.3%, a difference of 0.010%), Maltese (11.2%, a difference of 0.46%), Immigrants from Hong Kong (11.2%, a difference of 0.57%), Lithuanian (11.4%, a difference of 0.97%), and Latvian (11.4%, a difference of 1.3%).
| Demographics | Rating | Rank | Female Poverty |
| Filipinos | 100.0 /100 | #5 | Exceptional 10.9% |
| Immigrants | Ireland | 99.9 /100 | #6 | Exceptional 11.0% |
| Assyrians/Chaldeans/Syriacs | 99.9 /100 | #7 | Exceptional 11.0% |
| Immigrants | South Central Asia | 99.9 /100 | #8 | Exceptional 11.1% |
| Bulgarians | 99.9 /100 | #9 | Exceptional 11.1% |
| Immigrants | Hong Kong | 99.9 /100 | #10 | Exceptional 11.2% |
| Maltese | 99.9 /100 | #11 | Exceptional 11.2% |
| Bhutanese | 99.9 /100 | #12 | Exceptional 11.3% |
| Immigrants | Lithuania | 99.9 /100 | #13 | Exceptional 11.3% |
| Lithuanians | 99.8 /100 | #14 | Exceptional 11.4% |
| Latvians | 99.8 /100 | #15 | Exceptional 11.4% |
| Immigrants | Bolivia | 99.8 /100 | #16 | Exceptional 11.5% |
| Bolivians | 99.8 /100 | #17 | Exceptional 11.5% |
| Immigrants | Scotland | 99.8 /100 | #18 | Exceptional 11.5% |
| Norwegians | 99.8 /100 | #19 | Exceptional 11.5% |
Demographics Similar to Immigrants from Cuba by Female Poverty
In terms of female poverty, the demographic groups most similar to Immigrants from Cuba are Spanish American (16.2%, a difference of 0.050%), Immigrants from Haiti (16.1%, a difference of 0.080%), Comanche (16.2%, a difference of 0.13%), West Indian (16.1%, a difference of 0.24%), and Vietnamese (16.1%, a difference of 0.26%).
| Demographics | Rating | Rank | Female Poverty |
| Central Americans | 0.0 /100 | #276 | Tragic 16.0% |
| Bangladeshis | 0.0 /100 | #277 | Tragic 16.0% |
| Immigrants | West Indies | 0.0 /100 | #278 | Tragic 16.1% |
| Immigrants | Bahamas | 0.0 /100 | #279 | Tragic 16.1% |
| Vietnamese | 0.0 /100 | #280 | Tragic 16.1% |
| West Indians | 0.0 /100 | #281 | Tragic 16.1% |
| Immigrants | Haiti | 0.0 /100 | #282 | Tragic 16.1% |
| Immigrants | Cuba | 0.0 /100 | #283 | Tragic 16.1% |
| Spanish Americans | 0.0 /100 | #284 | Tragic 16.2% |
| Comanche | 0.0 /100 | #285 | Tragic 16.2% |
| Inupiat | 0.0 /100 | #286 | Tragic 16.2% |
| Immigrants | Belize | 0.0 /100 | #287 | Tragic 16.3% |
| Indonesians | 0.0 /100 | #288 | Tragic 16.4% |
| Blackfeet | 0.0 /100 | #289 | Tragic 16.4% |
| Immigrants | Bangladesh | 0.0 /100 | #290 | Tragic 16.4% |