Basque vs Soviet Union Median Family Income
COMPARE
Basque
Soviet Union
Median Family Income
Median Family Income Comparison
Basques
Soviet Union
$104,760
MEDIAN FAMILY INCOME
74.4/ 100
METRIC RATING
156th/ 347
METRIC RANK
$119,262
MEDIAN FAMILY INCOME
100.0/ 100
METRIC RATING
35th/ 347
METRIC RANK
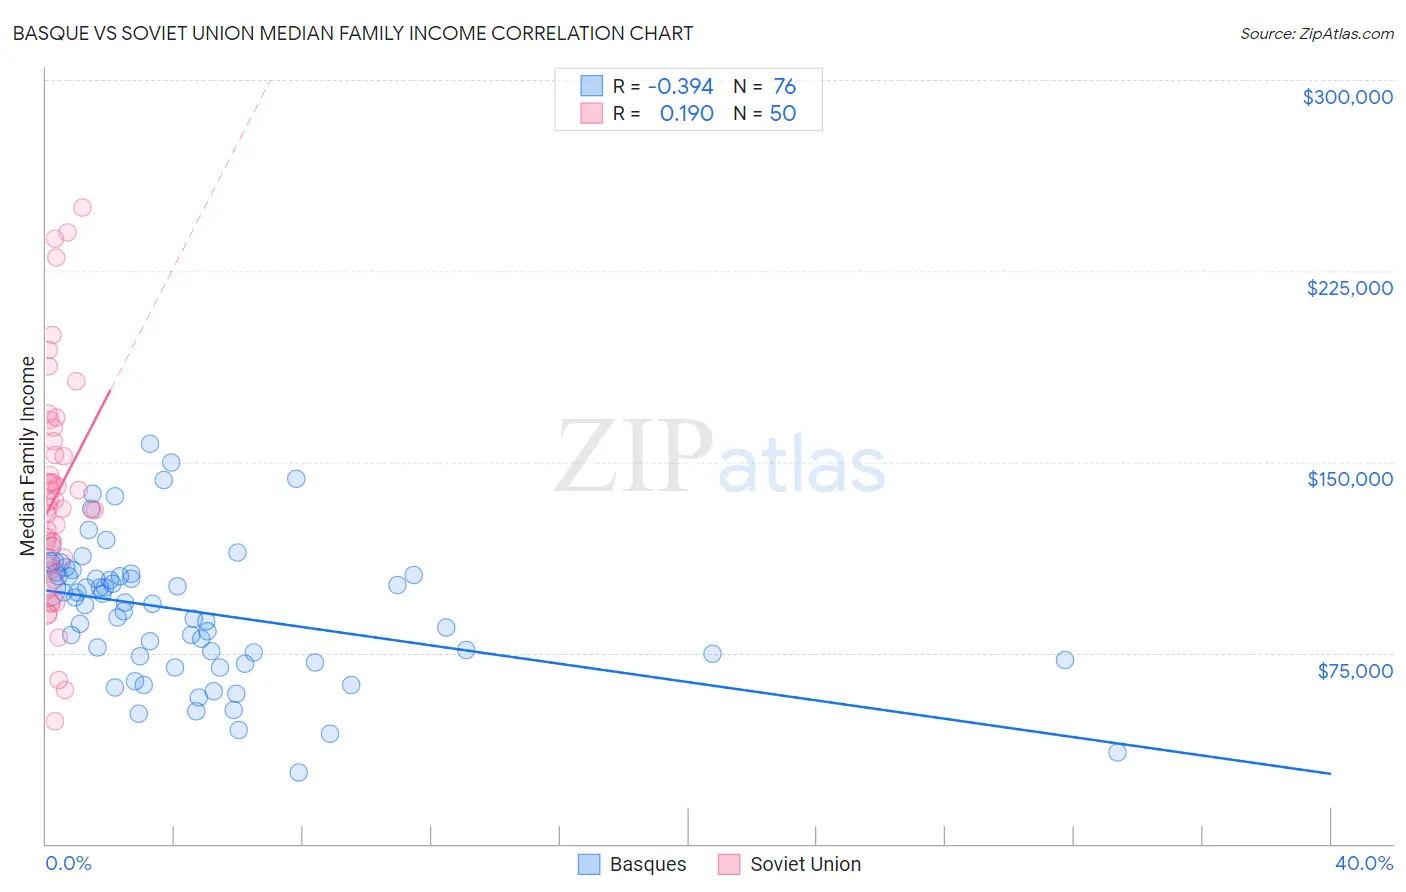
Basque vs Soviet Union Median Family Income Correlation Chart
The statistical analysis conducted on geographies consisting of 165,742,125 people shows a mild negative correlation between the proportion of Basques and median family income in the United States with a correlation coefficient (R) of -0.394 and weighted average of $104,760. Similarly, the statistical analysis conducted on geographies consisting of 43,509,630 people shows a poor positive correlation between the proportion of Soviet Union and median family income in the United States with a correlation coefficient (R) of 0.190 and weighted average of $119,262, a difference of 13.8%.
Median Family Income Correlation Summary
| Measurement | Basque | Soviet Union |
| Minimum | $28,036 | $48,254 |
| Maximum | $157,351 | $250,001 |
| Range | $129,315 | $201,747 |
| Mean | $91,256 | $137,051 |
| Median | $94,457 | $132,006 |
| Interquartile 25% (IQ1) | $72,725 | $109,232 |
| Interquartile 75% (IQ3) | $105,919 | $157,989 |
| Interquartile Range (IQR) | $33,194 | $48,757 |
| Standard Deviation (Sample) | $26,783 | $44,628 |
| Standard Deviation (Population) | $26,606 | $44,180 |
Similar Demographics by Median Family Income
Demographics Similar to Basques by Median Family Income
In terms of median family income, the demographic groups most similar to Basques are Native Hawaiian ($104,910, a difference of 0.14%), Immigrants from Nepal ($104,966, a difference of 0.20%), Moroccan ($104,488, a difference of 0.26%), Scandinavian ($104,410, a difference of 0.34%), and Swiss ($104,396, a difference of 0.35%).
| Demographics | Rating | Rank | Median Family Income |
| Immigrants | Germany | 80.9 /100 | #149 | Excellent $105,507 |
| Irish | 80.5 /100 | #150 | Excellent $105,453 |
| Peruvians | 80.4 /100 | #151 | Excellent $105,444 |
| Immigrants | Albania | 79.1 /100 | #152 | Good $105,285 |
| Slavs | 77.9 /100 | #153 | Good $105,144 |
| Immigrants | Nepal | 76.3 /100 | #154 | Good $104,966 |
| Native Hawaiians | 75.8 /100 | #155 | Good $104,910 |
| Basques | 74.4 /100 | #156 | Good $104,760 |
| Moroccans | 71.6 /100 | #157 | Good $104,488 |
| Scandinavians | 70.8 /100 | #158 | Good $104,410 |
| Swiss | 70.7 /100 | #159 | Good $104,396 |
| Scottish | 69.5 /100 | #160 | Good $104,288 |
| Icelanders | 69.4 /100 | #161 | Good $104,282 |
| Immigrants | Sierra Leone | 66.2 /100 | #162 | Good $103,990 |
| Costa Ricans | 66.2 /100 | #163 | Good $103,989 |
Demographics Similar to Soviet Union by Median Family Income
In terms of median family income, the demographic groups most similar to Soviet Union are Bolivian ($119,479, a difference of 0.18%), Bhutanese ($119,800, a difference of 0.45%), Asian ($119,955, a difference of 0.58%), Israeli ($118,577, a difference of 0.58%), and Immigrants from France ($120,076, a difference of 0.68%).
| Demographics | Rating | Rank | Median Family Income |
| Immigrants | Denmark | 100.0 /100 | #28 | Exceptional $120,445 |
| Latvians | 100.0 /100 | #29 | Exceptional $120,301 |
| Immigrants | Sri Lanka | 100.0 /100 | #30 | Exceptional $120,263 |
| Immigrants | France | 100.0 /100 | #31 | Exceptional $120,076 |
| Asians | 100.0 /100 | #32 | Exceptional $119,955 |
| Bhutanese | 100.0 /100 | #33 | Exceptional $119,800 |
| Bolivians | 100.0 /100 | #34 | Exceptional $119,479 |
| Soviet Union | 100.0 /100 | #35 | Exceptional $119,262 |
| Israelis | 100.0 /100 | #36 | Exceptional $118,577 |
| Australians | 100.0 /100 | #37 | Exceptional $118,440 |
| Immigrants | Turkey | 100.0 /100 | #38 | Exceptional $118,325 |
| Immigrants | Asia | 100.0 /100 | #39 | Exceptional $118,291 |
| Immigrants | Lithuania | 100.0 /100 | #40 | Exceptional $118,053 |
| Estonians | 100.0 /100 | #41 | Exceptional $118,013 |
| Immigrants | Bolivia | 100.0 /100 | #42 | Exceptional $117,912 |