Icelander vs Soviet Union Single Mother Poverty
COMPARE
Icelander
Soviet Union
Single Mother Poverty
Single Mother Poverty Comparison
Icelanders
Soviet Union
29.5%
SINGLE MOTHER POVERTY
26.1/ 100
METRIC RATING
194th/ 347
METRIC RANK
27.3%
SINGLE MOTHER POVERTY
99.5/ 100
METRIC RATING
66th/ 347
METRIC RANK
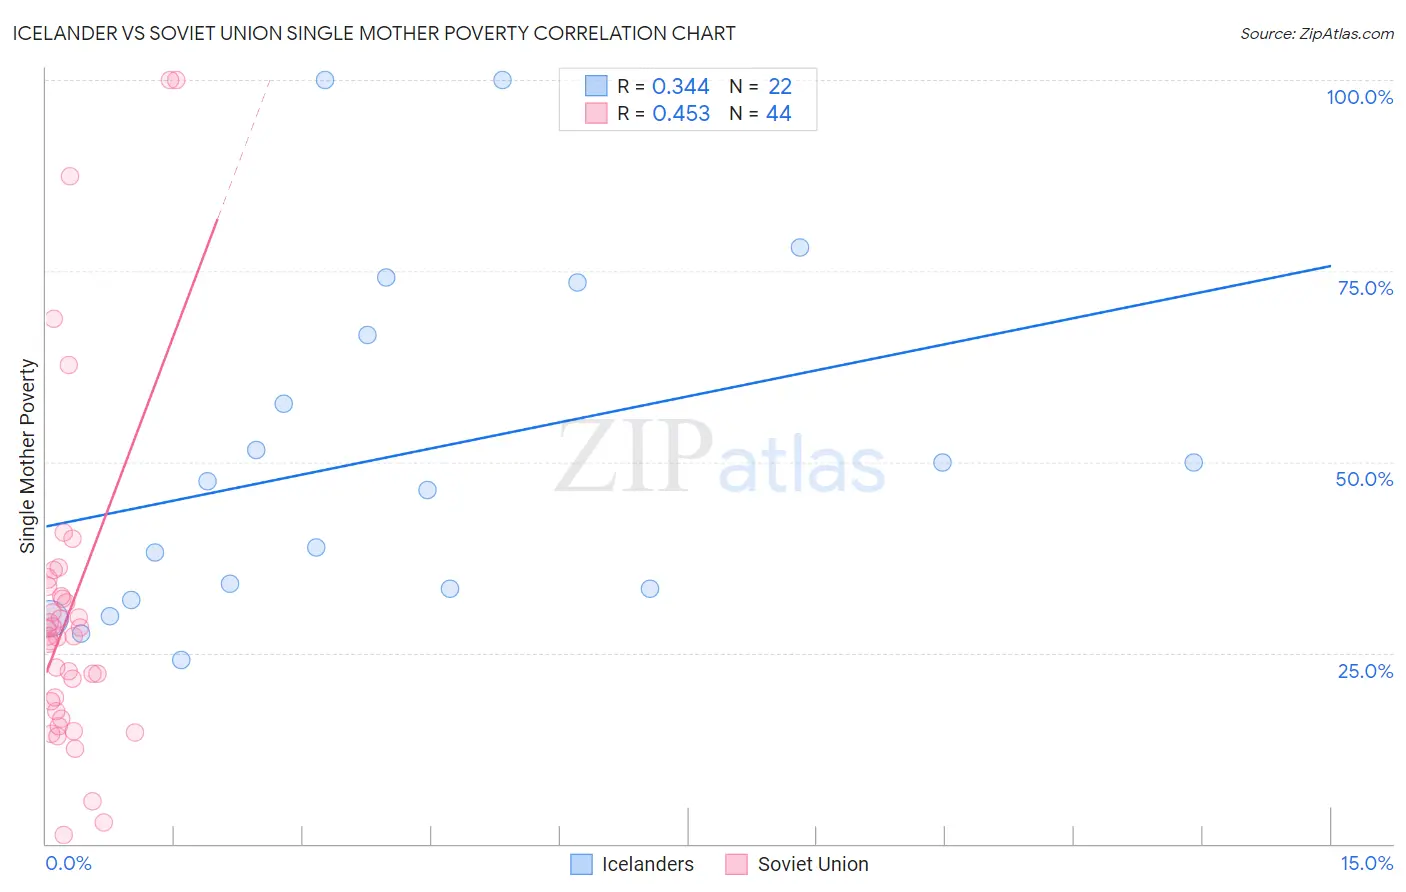
Icelander vs Soviet Union Single Mother Poverty Correlation Chart
The statistical analysis conducted on geographies consisting of 157,541,797 people shows a mild positive correlation between the proportion of Icelanders and poverty level among single mothers in the United States with a correlation coefficient (R) of 0.344 and weighted average of 29.5%. Similarly, the statistical analysis conducted on geographies consisting of 43,309,849 people shows a moderate positive correlation between the proportion of Soviet Union and poverty level among single mothers in the United States with a correlation coefficient (R) of 0.453 and weighted average of 27.3%, a difference of 8.0%.
Single Mother Poverty Correlation Summary
| Measurement | Icelander | Soviet Union |
| Minimum | 24.1% | 1.1% |
| Maximum | 100.0% | 100.0% |
| Range | 75.9% | 98.9% |
| Mean | 50.7% | 30.7% |
| Median | 46.9% | 27.2% |
| Interquartile 25% (IQ1) | 33.3% | 18.1% |
| Interquartile 75% (IQ3) | 66.7% | 33.0% |
| Interquartile Range (IQR) | 33.3% | 15.0% |
| Standard Deviation (Sample) | 22.6% | 21.9% |
| Standard Deviation (Population) | 22.0% | 21.6% |
Similar Demographics by Single Mother Poverty
Demographics Similar to Icelanders by Single Mother Poverty
In terms of single mother poverty, the demographic groups most similar to Icelanders are Slavic (29.6%, a difference of 0.10%), Basque (29.5%, a difference of 0.13%), Moroccan (29.5%, a difference of 0.15%), Spanish American Indian (29.6%, a difference of 0.17%), and Immigrants from Trinidad and Tobago (29.5%, a difference of 0.19%).
| Demographics | Rating | Rank | Single Mother Poverty |
| Lebanese | 32.5 /100 | #187 | Fair 29.4% |
| Guamanians/Chamorros | 31.8 /100 | #188 | Fair 29.4% |
| Immigrants | Africa | 31.6 /100 | #189 | Fair 29.4% |
| Immigrants | Germany | 30.4 /100 | #190 | Fair 29.5% |
| Immigrants | Trinidad and Tobago | 29.2 /100 | #191 | Fair 29.5% |
| Moroccans | 28.6 /100 | #192 | Fair 29.5% |
| Basques | 28.3 /100 | #193 | Fair 29.5% |
| Icelanders | 26.1 /100 | #194 | Fair 29.5% |
| Slavs | 24.5 /100 | #195 | Fair 29.6% |
| Spanish American Indians | 23.4 /100 | #196 | Fair 29.6% |
| Immigrants | Jamaica | 22.0 /100 | #197 | Fair 29.6% |
| Trinidadians and Tobagonians | 21.7 /100 | #198 | Fair 29.6% |
| Cubans | 20.8 /100 | #199 | Fair 29.6% |
| Panamanians | 20.0 /100 | #200 | Fair 29.6% |
| Belgians | 18.8 /100 | #201 | Poor 29.7% |
Demographics Similar to Soviet Union by Single Mother Poverty
In terms of single mother poverty, the demographic groups most similar to Soviet Union are Immigrants from Australia (27.3%, a difference of 0.020%), Immigrants from Turkey (27.3%, a difference of 0.040%), Immigrants from Czechoslovakia (27.4%, a difference of 0.050%), Russian (27.3%, a difference of 0.12%), and Immigrants from Northern Europe (27.3%, a difference of 0.15%).
| Demographics | Rating | Rank | Single Mother Poverty |
| Paraguayans | 99.6 /100 | #59 | Exceptional 27.2% |
| Eastern Europeans | 99.6 /100 | #60 | Exceptional 27.2% |
| Immigrants | Eastern Europe | 99.6 /100 | #61 | Exceptional 27.2% |
| Immigrants | Malaysia | 99.5 /100 | #62 | Exceptional 27.3% |
| Immigrants | Northern Europe | 99.5 /100 | #63 | Exceptional 27.3% |
| Russians | 99.5 /100 | #64 | Exceptional 27.3% |
| Immigrants | Turkey | 99.5 /100 | #65 | Exceptional 27.3% |
| Soviet Union | 99.5 /100 | #66 | Exceptional 27.3% |
| Immigrants | Australia | 99.5 /100 | #67 | Exceptional 27.3% |
| Immigrants | Czechoslovakia | 99.5 /100 | #68 | Exceptional 27.4% |
| Lithuanians | 99.4 /100 | #69 | Exceptional 27.4% |
| Immigrants | Belarus | 99.4 /100 | #70 | Exceptional 27.4% |
| Macedonians | 99.4 /100 | #71 | Exceptional 27.4% |
| Immigrants | Russia | 99.4 /100 | #72 | Exceptional 27.4% |
| Sierra Leoneans | 99.3 /100 | #73 | Exceptional 27.4% |