Sioux vs Soviet Union Single Mother Poverty
COMPARE
Sioux
Soviet Union
Single Mother Poverty
Single Mother Poverty Comparison
Sioux
Soviet Union
38.8%
SINGLE MOTHER POVERTY
0.0/ 100
METRIC RATING
340th/ 347
METRIC RANK
27.3%
SINGLE MOTHER POVERTY
99.5/ 100
METRIC RATING
66th/ 347
METRIC RANK
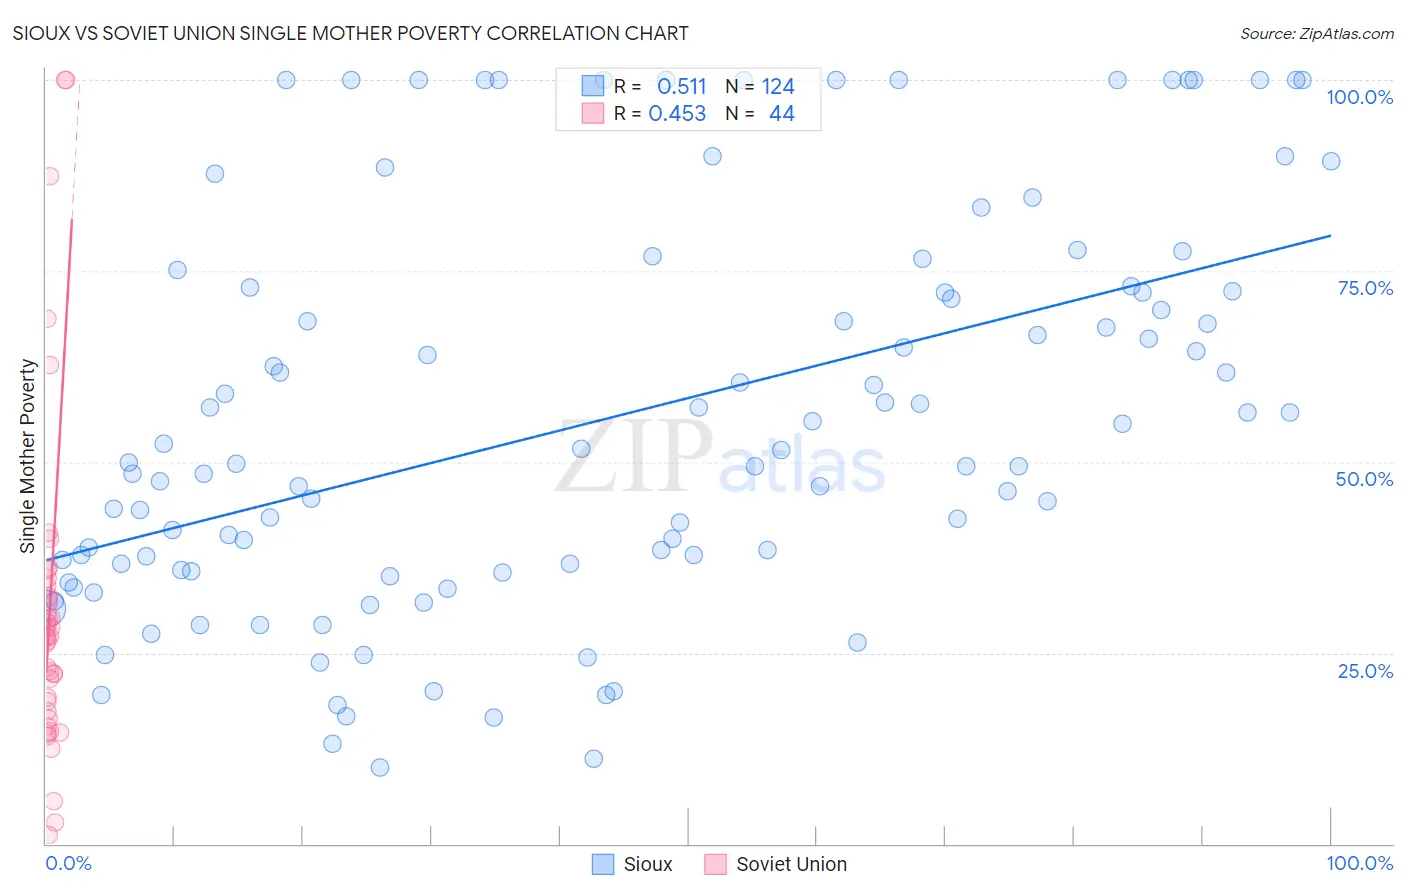
Sioux vs Soviet Union Single Mother Poverty Correlation Chart
The statistical analysis conducted on geographies consisting of 231,213,938 people shows a substantial positive correlation between the proportion of Sioux and poverty level among single mothers in the United States with a correlation coefficient (R) of 0.511 and weighted average of 38.8%. Similarly, the statistical analysis conducted on geographies consisting of 43,309,849 people shows a moderate positive correlation between the proportion of Soviet Union and poverty level among single mothers in the United States with a correlation coefficient (R) of 0.453 and weighted average of 27.3%, a difference of 41.9%.
Single Mother Poverty Correlation Summary
| Measurement | Sioux | Soviet Union |
| Minimum | 10.0% | 1.1% |
| Maximum | 100.0% | 100.0% |
| Range | 90.0% | 98.9% |
| Mean | 55.8% | 30.7% |
| Median | 50.7% | 27.2% |
| Interquartile 25% (IQ1) | 36.2% | 18.1% |
| Interquartile 75% (IQ3) | 72.6% | 33.0% |
| Interquartile Range (IQR) | 36.4% | 15.0% |
| Standard Deviation (Sample) | 25.6% | 21.9% |
| Standard Deviation (Population) | 25.5% | 21.6% |
Similar Demographics by Single Mother Poverty
Demographics Similar to Sioux by Single Mother Poverty
In terms of single mother poverty, the demographic groups most similar to Sioux are Crow (38.6%, a difference of 0.40%), Pima (38.6%, a difference of 0.49%), Immigrants from Yemen (38.5%, a difference of 0.70%), Cheyenne (38.5%, a difference of 0.74%), and Colville (39.3%, a difference of 1.3%).
| Demographics | Rating | Rank | Single Mother Poverty |
| Menominee | 0.0 /100 | #333 | Tragic 37.1% |
| Pueblo | 0.0 /100 | #334 | Tragic 37.2% |
| Yuman | 0.0 /100 | #335 | Tragic 37.8% |
| Cheyenne | 0.0 /100 | #336 | Tragic 38.5% |
| Immigrants | Yemen | 0.0 /100 | #337 | Tragic 38.5% |
| Pima | 0.0 /100 | #338 | Tragic 38.6% |
| Crow | 0.0 /100 | #339 | Tragic 38.6% |
| Sioux | 0.0 /100 | #340 | Tragic 38.8% |
| Colville | 0.0 /100 | #341 | Tragic 39.3% |
| Navajo | 0.0 /100 | #342 | Tragic 40.2% |
| Cajuns | 0.0 /100 | #343 | Tragic 40.3% |
| Tohono O'odham | 0.0 /100 | #344 | Tragic 43.0% |
| Lumbee | 0.0 /100 | #345 | Tragic 43.2% |
| Houma | 0.0 /100 | #346 | Tragic 43.5% |
| Puerto Ricans | 0.0 /100 | #347 | Tragic 44.5% |
Demographics Similar to Soviet Union by Single Mother Poverty
In terms of single mother poverty, the demographic groups most similar to Soviet Union are Immigrants from Australia (27.3%, a difference of 0.020%), Immigrants from Turkey (27.3%, a difference of 0.040%), Immigrants from Czechoslovakia (27.4%, a difference of 0.050%), Russian (27.3%, a difference of 0.12%), and Immigrants from Northern Europe (27.3%, a difference of 0.15%).
| Demographics | Rating | Rank | Single Mother Poverty |
| Paraguayans | 99.6 /100 | #59 | Exceptional 27.2% |
| Eastern Europeans | 99.6 /100 | #60 | Exceptional 27.2% |
| Immigrants | Eastern Europe | 99.6 /100 | #61 | Exceptional 27.2% |
| Immigrants | Malaysia | 99.5 /100 | #62 | Exceptional 27.3% |
| Immigrants | Northern Europe | 99.5 /100 | #63 | Exceptional 27.3% |
| Russians | 99.5 /100 | #64 | Exceptional 27.3% |
| Immigrants | Turkey | 99.5 /100 | #65 | Exceptional 27.3% |
| Soviet Union | 99.5 /100 | #66 | Exceptional 27.3% |
| Immigrants | Australia | 99.5 /100 | #67 | Exceptional 27.3% |
| Immigrants | Czechoslovakia | 99.5 /100 | #68 | Exceptional 27.4% |
| Lithuanians | 99.4 /100 | #69 | Exceptional 27.4% |
| Immigrants | Belarus | 99.4 /100 | #70 | Exceptional 27.4% |
| Macedonians | 99.4 /100 | #71 | Exceptional 27.4% |
| Immigrants | Russia | 99.4 /100 | #72 | Exceptional 27.4% |
| Sierra Leoneans | 99.3 /100 | #73 | Exceptional 27.4% |