Iroquois vs Soviet Union Single Mother Poverty
COMPARE
Iroquois
Soviet Union
Single Mother Poverty
Single Mother Poverty Comparison
Iroquois
Soviet Union
34.8%
SINGLE MOTHER POVERTY
0.0/ 100
METRIC RATING
320th/ 347
METRIC RANK
27.3%
SINGLE MOTHER POVERTY
99.5/ 100
METRIC RATING
66th/ 347
METRIC RANK
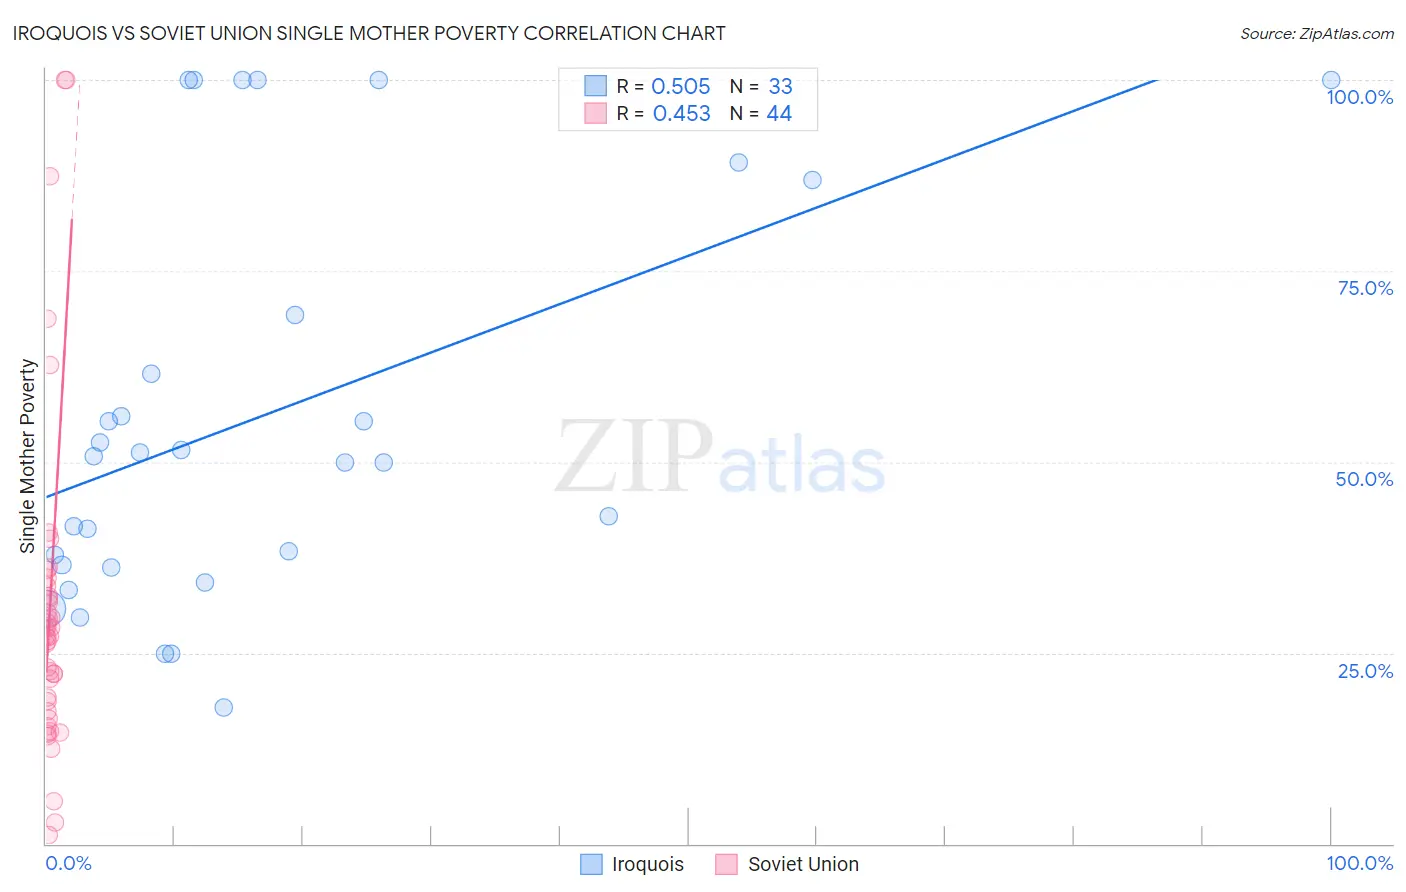
Iroquois vs Soviet Union Single Mother Poverty Correlation Chart
The statistical analysis conducted on geographies consisting of 204,844,819 people shows a substantial positive correlation between the proportion of Iroquois and poverty level among single mothers in the United States with a correlation coefficient (R) of 0.505 and weighted average of 34.8%. Similarly, the statistical analysis conducted on geographies consisting of 43,309,849 people shows a moderate positive correlation between the proportion of Soviet Union and poverty level among single mothers in the United States with a correlation coefficient (R) of 0.453 and weighted average of 27.3%, a difference of 27.5%.
Single Mother Poverty Correlation Summary
| Measurement | Iroquois | Soviet Union |
| Minimum | 17.9% | 1.1% |
| Maximum | 100.0% | 100.0% |
| Range | 82.1% | 98.9% |
| Mean | 56.0% | 30.7% |
| Median | 50.8% | 27.2% |
| Interquartile 25% (IQ1) | 36.4% | 18.1% |
| Interquartile 75% (IQ3) | 78.1% | 33.0% |
| Interquartile Range (IQR) | 41.7% | 15.0% |
| Standard Deviation (Sample) | 26.1% | 21.9% |
| Standard Deviation (Population) | 25.7% | 21.6% |
Similar Demographics by Single Mother Poverty
Demographics Similar to Iroquois by Single Mother Poverty
In terms of single mother poverty, the demographic groups most similar to Iroquois are Chippewa (34.8%, a difference of 0.24%), Immigrants from Honduras (34.7%, a difference of 0.39%), Paiute (35.1%, a difference of 0.87%), Cherokee (34.5%, a difference of 0.91%), and Dominican (34.5%, a difference of 1.0%).
| Demographics | Rating | Rank | Single Mother Poverty |
| Immigrants | Dominican Republic | 0.0 /100 | #313 | Tragic 34.4% |
| Chickasaw | 0.0 /100 | #314 | Tragic 34.4% |
| Hopi | 0.0 /100 | #315 | Tragic 34.5% |
| Dominicans | 0.0 /100 | #316 | Tragic 34.5% |
| Cherokee | 0.0 /100 | #317 | Tragic 34.5% |
| Immigrants | Honduras | 0.0 /100 | #318 | Tragic 34.7% |
| Chippewa | 0.0 /100 | #319 | Tragic 34.8% |
| Iroquois | 0.0 /100 | #320 | Tragic 34.8% |
| Paiute | 0.0 /100 | #321 | Tragic 35.1% |
| Blacks/African Americans | 0.0 /100 | #322 | Tragic 35.2% |
| Kiowa | 0.0 /100 | #323 | Tragic 35.5% |
| Ottawa | 0.0 /100 | #324 | Tragic 35.5% |
| Ute | 0.0 /100 | #325 | Tragic 35.7% |
| Seminole | 0.0 /100 | #326 | Tragic 35.8% |
| Yakama | 0.0 /100 | #327 | Tragic 36.4% |
Demographics Similar to Soviet Union by Single Mother Poverty
In terms of single mother poverty, the demographic groups most similar to Soviet Union are Immigrants from Australia (27.3%, a difference of 0.020%), Immigrants from Turkey (27.3%, a difference of 0.040%), Immigrants from Czechoslovakia (27.4%, a difference of 0.050%), Russian (27.3%, a difference of 0.12%), and Immigrants from Northern Europe (27.3%, a difference of 0.15%).
| Demographics | Rating | Rank | Single Mother Poverty |
| Paraguayans | 99.6 /100 | #59 | Exceptional 27.2% |
| Eastern Europeans | 99.6 /100 | #60 | Exceptional 27.2% |
| Immigrants | Eastern Europe | 99.6 /100 | #61 | Exceptional 27.2% |
| Immigrants | Malaysia | 99.5 /100 | #62 | Exceptional 27.3% |
| Immigrants | Northern Europe | 99.5 /100 | #63 | Exceptional 27.3% |
| Russians | 99.5 /100 | #64 | Exceptional 27.3% |
| Immigrants | Turkey | 99.5 /100 | #65 | Exceptional 27.3% |
| Soviet Union | 99.5 /100 | #66 | Exceptional 27.3% |
| Immigrants | Australia | 99.5 /100 | #67 | Exceptional 27.3% |
| Immigrants | Czechoslovakia | 99.5 /100 | #68 | Exceptional 27.4% |
| Lithuanians | 99.4 /100 | #69 | Exceptional 27.4% |
| Immigrants | Belarus | 99.4 /100 | #70 | Exceptional 27.4% |
| Macedonians | 99.4 /100 | #71 | Exceptional 27.4% |
| Immigrants | Russia | 99.4 /100 | #72 | Exceptional 27.4% |
| Sierra Leoneans | 99.3 /100 | #73 | Exceptional 27.4% |