Russian vs Soviet Union Single Mother Poverty
COMPARE
Russian
Soviet Union
Single Mother Poverty
Single Mother Poverty Comparison
Russians
Soviet Union
27.3%
SINGLE MOTHER POVERTY
99.5/ 100
METRIC RATING
64th/ 347
METRIC RANK
27.3%
SINGLE MOTHER POVERTY
99.5/ 100
METRIC RATING
66th/ 347
METRIC RANK
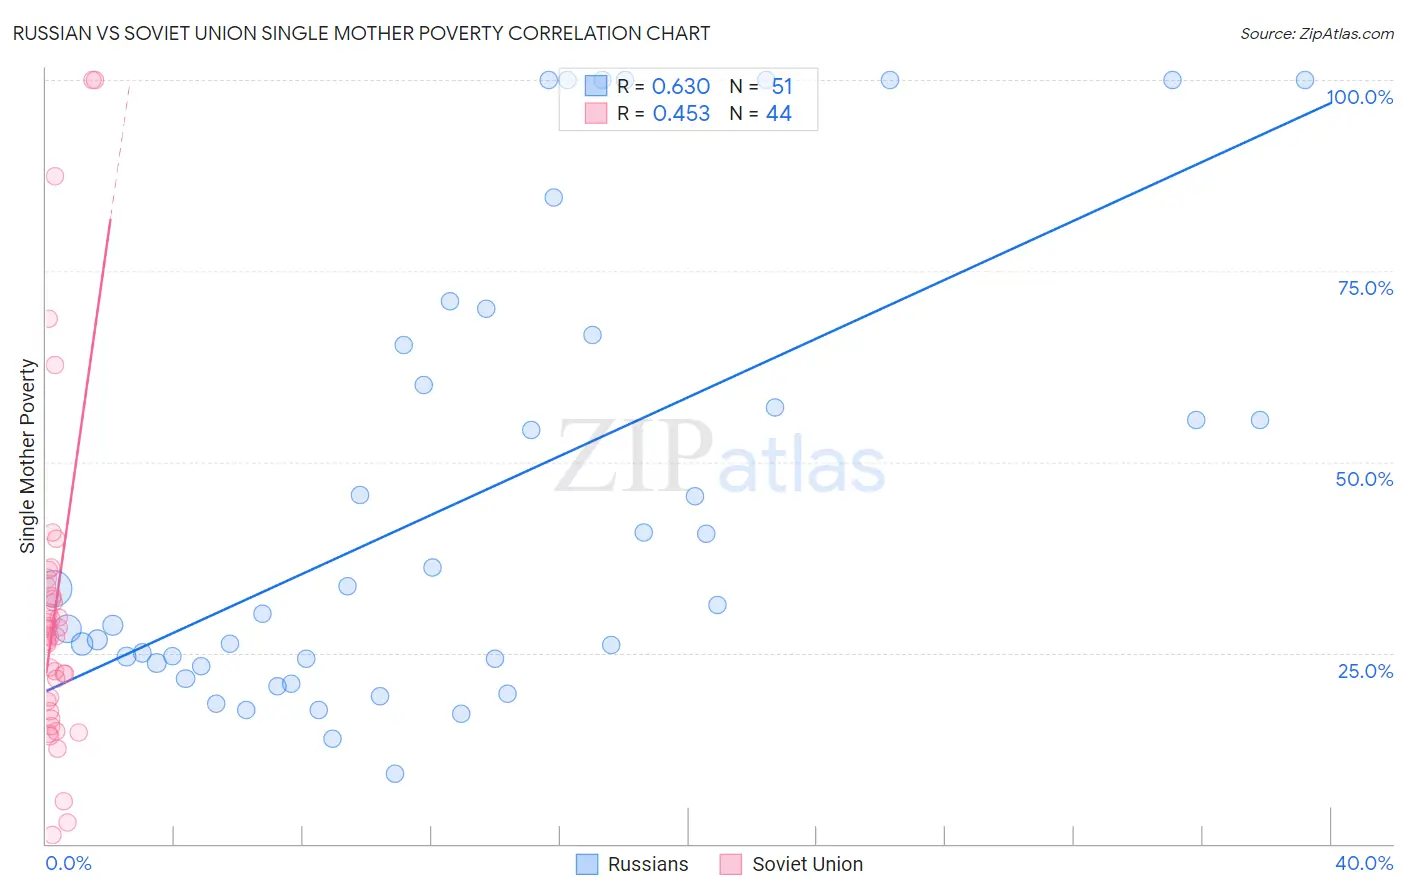
Russian vs Soviet Union Single Mother Poverty Correlation Chart
The statistical analysis conducted on geographies consisting of 491,168,299 people shows a significant positive correlation between the proportion of Russians and poverty level among single mothers in the United States with a correlation coefficient (R) of 0.630 and weighted average of 27.3%. Similarly, the statistical analysis conducted on geographies consisting of 43,309,849 people shows a moderate positive correlation between the proportion of Soviet Union and poverty level among single mothers in the United States with a correlation coefficient (R) of 0.453 and weighted average of 27.3%, a difference of 0.12%.
Single Mother Poverty Correlation Summary
| Measurement | Russian | Soviet Union |
| Minimum | 9.2% | 1.1% |
| Maximum | 100.0% | 100.0% |
| Range | 90.8% | 98.9% |
| Mean | 45.2% | 30.7% |
| Median | 31.2% | 27.2% |
| Interquartile 25% (IQ1) | 23.7% | 18.1% |
| Interquartile 75% (IQ3) | 65.4% | 33.0% |
| Interquartile Range (IQR) | 41.7% | 15.0% |
| Standard Deviation (Sample) | 29.2% | 21.9% |
| Standard Deviation (Population) | 28.9% | 21.6% |
Demographics Similar to Russians and Soviet Union by Single Mother Poverty
In terms of single mother poverty, the demographic groups most similar to Russians are Immigrants from Northern Europe (27.3%, a difference of 0.030%), Immigrants from Malaysia (27.3%, a difference of 0.080%), Immigrants from Turkey (27.3%, a difference of 0.080%), Immigrants from Australia (27.3%, a difference of 0.14%), and Immigrants from Czechoslovakia (27.4%, a difference of 0.17%). Similarly, the demographic groups most similar to Soviet Union are Immigrants from Australia (27.3%, a difference of 0.020%), Immigrants from Turkey (27.3%, a difference of 0.040%), Immigrants from Czechoslovakia (27.4%, a difference of 0.050%), Immigrants from Northern Europe (27.3%, a difference of 0.15%), and Immigrants from Malaysia (27.3%, a difference of 0.19%).
| Demographics | Rating | Rank | Single Mother Poverty |
| Immigrants | Egypt | 99.7 /100 | #55 | Exceptional 27.1% |
| Immigrants | Romania | 99.7 /100 | #56 | Exceptional 27.2% |
| Palestinians | 99.7 /100 | #57 | Exceptional 27.2% |
| Argentineans | 99.6 /100 | #58 | Exceptional 27.2% |
| Paraguayans | 99.6 /100 | #59 | Exceptional 27.2% |
| Eastern Europeans | 99.6 /100 | #60 | Exceptional 27.2% |
| Immigrants | Eastern Europe | 99.6 /100 | #61 | Exceptional 27.2% |
| Immigrants | Malaysia | 99.5 /100 | #62 | Exceptional 27.3% |
| Immigrants | Northern Europe | 99.5 /100 | #63 | Exceptional 27.3% |
| Russians | 99.5 /100 | #64 | Exceptional 27.3% |
| Immigrants | Turkey | 99.5 /100 | #65 | Exceptional 27.3% |
| Soviet Union | 99.5 /100 | #66 | Exceptional 27.3% |
| Immigrants | Australia | 99.5 /100 | #67 | Exceptional 27.3% |
| Immigrants | Czechoslovakia | 99.5 /100 | #68 | Exceptional 27.4% |
| Lithuanians | 99.4 /100 | #69 | Exceptional 27.4% |
| Immigrants | Belarus | 99.4 /100 | #70 | Exceptional 27.4% |
| Macedonians | 99.4 /100 | #71 | Exceptional 27.4% |
| Immigrants | Russia | 99.4 /100 | #72 | Exceptional 27.4% |
| Sierra Leoneans | 99.3 /100 | #73 | Exceptional 27.4% |
| Immigrants | Europe | 99.3 /100 | #74 | Exceptional 27.4% |
| Immigrants | Sweden | 99.2 /100 | #75 | Exceptional 27.5% |