Romanian vs Immigrants from Norway Single Mother Poverty
COMPARE
Romanian
Immigrants from Norway
Single Mother Poverty
Single Mother Poverty Comparison
Romanians
Immigrants from Norway
27.8%
SINGLE MOTHER POVERTY
97.8/ 100
METRIC RATING
93rd/ 347
METRIC RANK
29.3%
SINGLE MOTHER POVERTY
41.5/ 100
METRIC RATING
180th/ 347
METRIC RANK
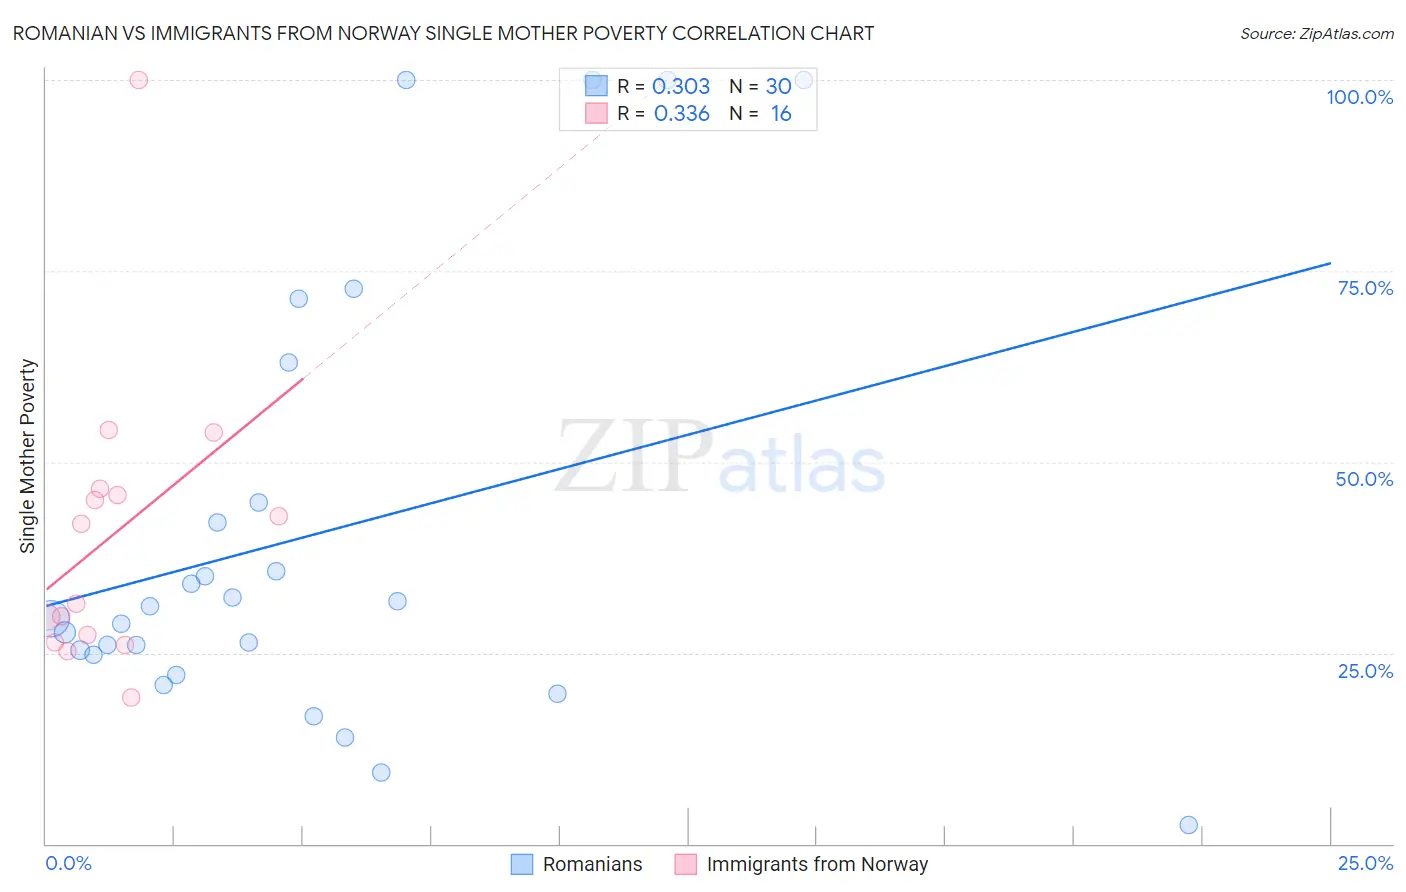
Romanian vs Immigrants from Norway Single Mother Poverty Correlation Chart
The statistical analysis conducted on geographies consisting of 367,510,657 people shows a mild positive correlation between the proportion of Romanians and poverty level among single mothers in the United States with a correlation coefficient (R) of 0.303 and weighted average of 27.8%. Similarly, the statistical analysis conducted on geographies consisting of 115,092,728 people shows a mild positive correlation between the proportion of Immigrants from Norway and poverty level among single mothers in the United States with a correlation coefficient (R) of 0.336 and weighted average of 29.3%, a difference of 5.2%.
Single Mother Poverty Correlation Summary
| Measurement | Romanian | Immigrants from Norway |
| Minimum | 2.5% | 19.1% |
| Maximum | 100.0% | 100.0% |
| Range | 97.5% | 80.9% |
| Mean | 40.4% | 40.3% |
| Median | 30.2% | 36.6% |
| Interquartile 25% (IQ1) | 24.8% | 26.8% |
| Interquartile 75% (IQ3) | 44.7% | 46.1% |
| Interquartile Range (IQR) | 19.9% | 19.3% |
| Standard Deviation (Sample) | 28.4% | 19.3% |
| Standard Deviation (Population) | 27.9% | 18.7% |
Similar Demographics by Single Mother Poverty
Demographics Similar to Romanians by Single Mother Poverty
In terms of single mother poverty, the demographic groups most similar to Romanians are Estonian (27.8%, a difference of 0.10%), Albanian (27.9%, a difference of 0.10%), Immigrants from Albania (27.8%, a difference of 0.12%), Chilean (27.9%, a difference of 0.13%), and Immigrants from Iraq (27.9%, a difference of 0.23%).
| Demographics | Rating | Rank | Single Mother Poverty |
| Immigrants | Ukraine | 98.6 /100 | #86 | Exceptional 27.7% |
| Afghans | 98.5 /100 | #87 | Exceptional 27.7% |
| Ethiopians | 98.4 /100 | #88 | Exceptional 27.7% |
| Immigrants | Ethiopia | 98.4 /100 | #89 | Exceptional 27.7% |
| Immigrants | France | 98.2 /100 | #90 | Exceptional 27.8% |
| Immigrants | Albania | 98.0 /100 | #91 | Exceptional 27.8% |
| Estonians | 97.9 /100 | #92 | Exceptional 27.8% |
| Romanians | 97.8 /100 | #93 | Exceptional 27.8% |
| Albanians | 97.6 /100 | #94 | Exceptional 27.9% |
| Chileans | 97.5 /100 | #95 | Exceptional 27.9% |
| Immigrants | Iraq | 97.3 /100 | #96 | Exceptional 27.9% |
| Immigrants | Brazil | 97.2 /100 | #97 | Exceptional 27.9% |
| Immigrants | Nepal | 97.2 /100 | #98 | Exceptional 27.9% |
| Immigrants | Netherlands | 97.2 /100 | #99 | Exceptional 27.9% |
| Zimbabweans | 97.1 /100 | #100 | Exceptional 27.9% |
Demographics Similar to Immigrants from Norway by Single Mother Poverty
In terms of single mother poverty, the demographic groups most similar to Immigrants from Norway are Immigrants from Uzbekistan (29.3%, a difference of 0.050%), Canadian (29.3%, a difference of 0.060%), South American Indian (29.3%, a difference of 0.090%), Immigrants from Eastern Africa (29.3%, a difference of 0.15%), and Nepalese (29.3%, a difference of 0.16%).
| Demographics | Rating | Rank | Single Mother Poverty |
| British | 50.6 /100 | #173 | Average 29.2% |
| Immigrants | Saudi Arabia | 50.0 /100 | #174 | Average 29.2% |
| Immigrants | Costa Rica | 48.8 /100 | #175 | Average 29.2% |
| Hawaiians | 47.8 /100 | #176 | Average 29.2% |
| Immigrants | Bosnia and Herzegovina | 45.1 /100 | #177 | Average 29.2% |
| South American Indians | 43.2 /100 | #178 | Average 29.3% |
| Immigrants | Uzbekistan | 42.6 /100 | #179 | Average 29.3% |
| Immigrants | Norway | 41.5 /100 | #180 | Average 29.3% |
| Canadians | 40.4 /100 | #181 | Average 29.3% |
| Immigrants | Eastern Africa | 38.5 /100 | #182 | Fair 29.3% |
| Nepalese | 38.3 /100 | #183 | Fair 29.3% |
| Nigerians | 38.0 /100 | #184 | Fair 29.3% |
| Ghanaians | 36.8 /100 | #185 | Fair 29.4% |
| Yugoslavians | 36.0 /100 | #186 | Fair 29.4% |
| Lebanese | 32.5 /100 | #187 | Fair 29.4% |