Barbadian vs Immigrants from Norway Male Poverty
COMPARE
Barbadian
Immigrants from Norway
Male Poverty
Male Poverty Comparison
Barbadians
Immigrants from Norway
13.6%
MALE POVERTY
0.0/ 100
METRIC RATING
275th/ 347
METRIC RANK
10.7%
MALE POVERTY
86.0/ 100
METRIC RATING
125th/ 347
METRIC RANK
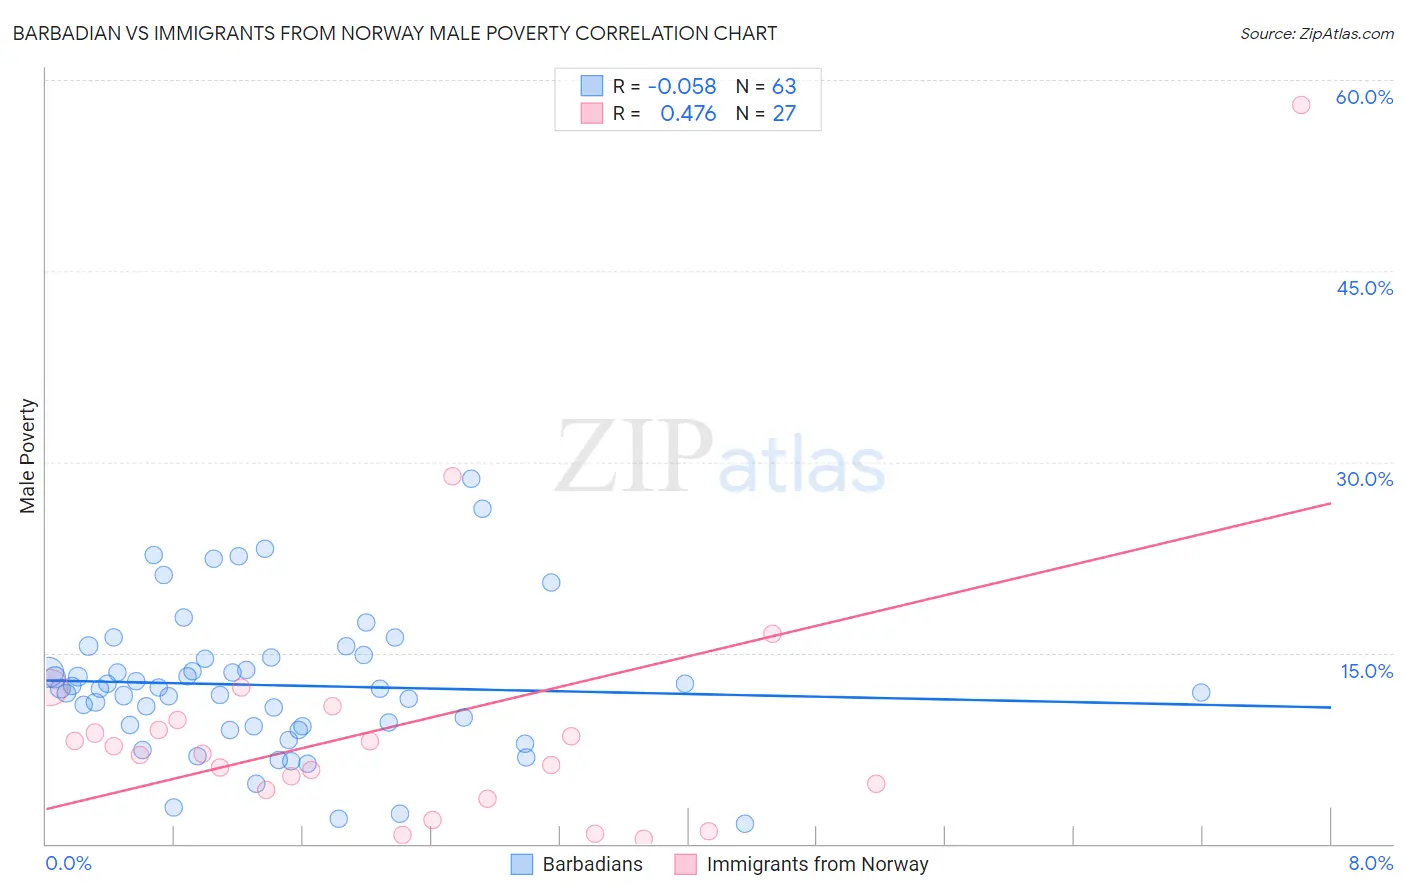
Barbadian vs Immigrants from Norway Male Poverty Correlation Chart
The statistical analysis conducted on geographies consisting of 141,266,401 people shows a slight negative correlation between the proportion of Barbadians and poverty level among males in the United States with a correlation coefficient (R) of -0.058 and weighted average of 13.6%. Similarly, the statistical analysis conducted on geographies consisting of 116,684,379 people shows a moderate positive correlation between the proportion of Immigrants from Norway and poverty level among males in the United States with a correlation coefficient (R) of 0.476 and weighted average of 10.7%, a difference of 27.1%.
Male Poverty Correlation Summary
| Measurement | Barbadian | Immigrants from Norway |
| Minimum | 1.6% | 0.44% |
| Maximum | 28.7% | 58.1% |
| Range | 27.1% | 57.6% |
| Mean | 12.5% | 9.4% |
| Median | 12.2% | 7.1% |
| Interquartile 25% (IQ1) | 9.2% | 4.2% |
| Interquartile 75% (IQ3) | 14.7% | 9.7% |
| Interquartile Range (IQR) | 5.5% | 5.6% |
| Standard Deviation (Sample) | 5.6% | 11.3% |
| Standard Deviation (Population) | 5.5% | 11.1% |
Similar Demographics by Male Poverty
Demographics Similar to Barbadians by Male Poverty
In terms of male poverty, the demographic groups most similar to Barbadians are Immigrants from Latin America (13.6%, a difference of 0.19%), Bangladeshi (13.6%, a difference of 0.34%), Belizean (13.6%, a difference of 0.44%), Haitian (13.7%, a difference of 0.61%), and Immigrants from West Indies (13.5%, a difference of 0.62%).
| Demographics | Rating | Rank | Male Poverty |
| Sub-Saharan Africans | 0.1 /100 | #268 | Tragic 13.3% |
| Guyanese | 0.0 /100 | #269 | Tragic 13.3% |
| Cree | 0.0 /100 | #270 | Tragic 13.3% |
| Spanish Americans | 0.0 /100 | #271 | Tragic 13.4% |
| Immigrants | Bahamas | 0.0 /100 | #272 | Tragic 13.5% |
| Chickasaw | 0.0 /100 | #273 | Tragic 13.5% |
| Immigrants | West Indies | 0.0 /100 | #274 | Tragic 13.5% |
| Barbadians | 0.0 /100 | #275 | Tragic 13.6% |
| Immigrants | Latin America | 0.0 /100 | #276 | Tragic 13.6% |
| Bangladeshis | 0.0 /100 | #277 | Tragic 13.6% |
| Belizeans | 0.0 /100 | #278 | Tragic 13.6% |
| Haitians | 0.0 /100 | #279 | Tragic 13.7% |
| Mexicans | 0.0 /100 | #280 | Tragic 13.7% |
| Yaqui | 0.0 /100 | #281 | Tragic 13.7% |
| Immigrants | Cabo Verde | 0.0 /100 | #282 | Tragic 13.7% |
Demographics Similar to Immigrants from Norway by Male Poverty
In terms of male poverty, the demographic groups most similar to Immigrants from Norway are French (10.7%, a difference of 0.15%), South African (10.7%, a difference of 0.18%), Native Hawaiian (10.7%, a difference of 0.22%), Peruvian (10.7%, a difference of 0.23%), and Immigrants from China (10.7%, a difference of 0.25%).
| Demographics | Rating | Rank | Male Poverty |
| Okinawans | 87.6 /100 | #118 | Excellent 10.7% |
| Immigrants | Hungary | 87.6 /100 | #119 | Excellent 10.7% |
| Immigrants | China | 87.1 /100 | #120 | Excellent 10.7% |
| Peruvians | 87.1 /100 | #121 | Excellent 10.7% |
| Native Hawaiians | 87.0 /100 | #122 | Excellent 10.7% |
| South Africans | 86.8 /100 | #123 | Excellent 10.7% |
| French | 86.7 /100 | #124 | Excellent 10.7% |
| Immigrants | Norway | 86.0 /100 | #125 | Excellent 10.7% |
| Immigrants | Ukraine | 84.3 /100 | #126 | Excellent 10.7% |
| Puget Sound Salish | 84.3 /100 | #127 | Excellent 10.7% |
| Immigrants | Western Europe | 84.2 /100 | #128 | Excellent 10.7% |
| Immigrants | Peru | 84.1 /100 | #129 | Excellent 10.7% |
| Chileans | 83.9 /100 | #130 | Excellent 10.7% |
| Immigrants | Belarus | 83.3 /100 | #131 | Excellent 10.7% |
| Immigrants | Vietnam | 83.0 /100 | #132 | Excellent 10.8% |