Nonimmigrants vs Immigrants from Norway Single Mother Poverty
COMPARE
Nonimmigrants
Immigrants from Norway
Single Mother Poverty
Single Mother Poverty Comparison
Nonimmigrants
Immigrants from Norway
32.2%
SINGLE MOTHER POVERTY
0.0/ 100
METRIC RATING
280th/ 347
METRIC RANK
29.3%
SINGLE MOTHER POVERTY
41.5/ 100
METRIC RATING
180th/ 347
METRIC RANK
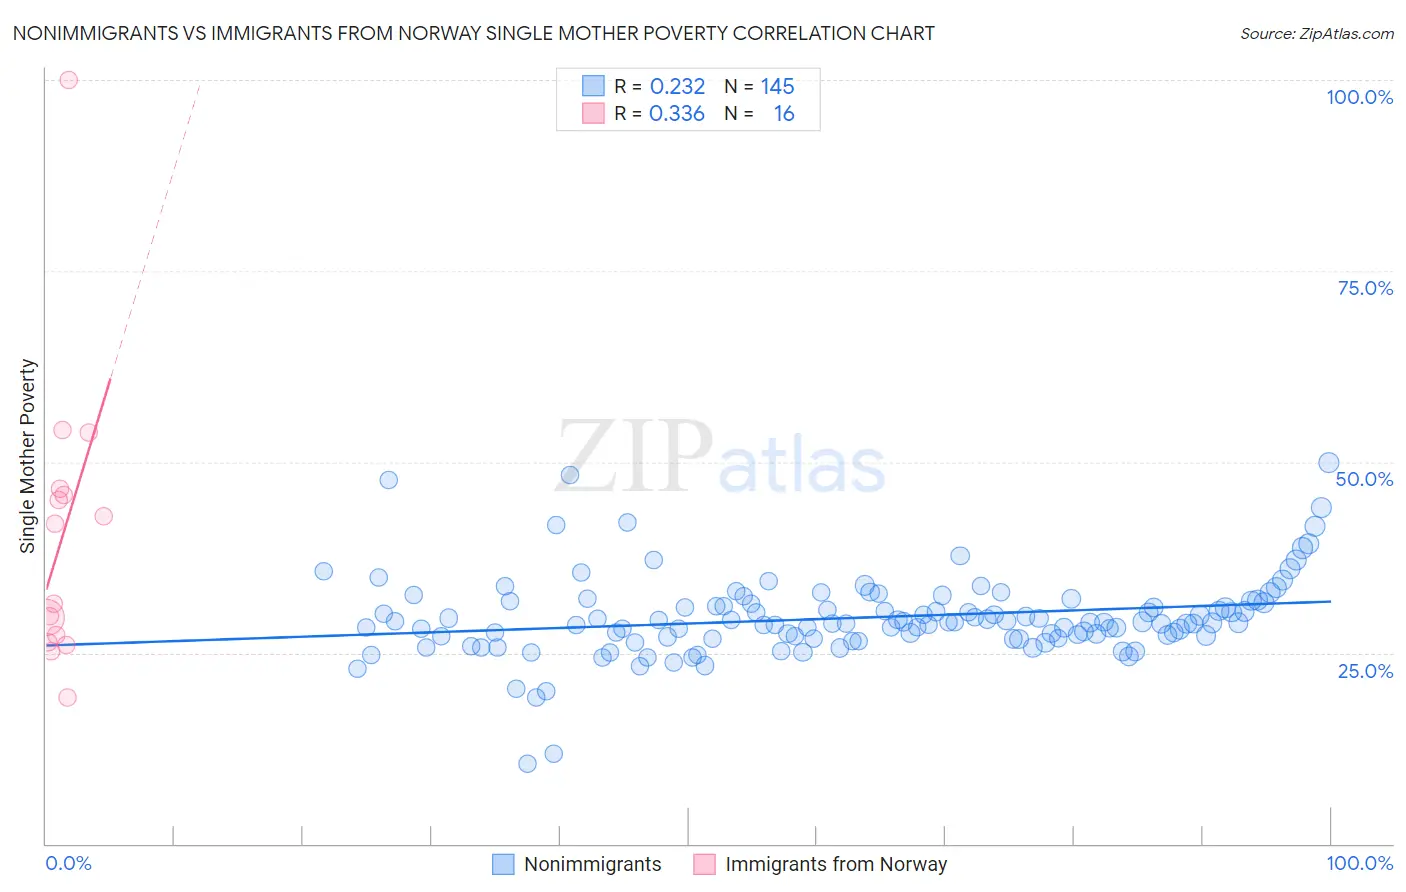
Nonimmigrants vs Immigrants from Norway Single Mother Poverty Correlation Chart
The statistical analysis conducted on geographies consisting of 553,388,851 people shows a weak positive correlation between the proportion of Nonimmigrants and poverty level among single mothers in the United States with a correlation coefficient (R) of 0.232 and weighted average of 32.2%. Similarly, the statistical analysis conducted on geographies consisting of 115,092,728 people shows a mild positive correlation between the proportion of Immigrants from Norway and poverty level among single mothers in the United States with a correlation coefficient (R) of 0.336 and weighted average of 29.3%, a difference of 9.8%.
Single Mother Poverty Correlation Summary
| Measurement | Nonimmigrants | Immigrants from Norway |
| Minimum | 10.6% | 19.1% |
| Maximum | 49.9% | 100.0% |
| Range | 39.4% | 80.9% |
| Mean | 29.6% | 40.3% |
| Median | 29.0% | 36.6% |
| Interquartile 25% (IQ1) | 27.0% | 26.8% |
| Interquartile 75% (IQ3) | 31.7% | 46.1% |
| Interquartile Range (IQR) | 4.7% | 19.3% |
| Standard Deviation (Sample) | 5.4% | 19.3% |
| Standard Deviation (Population) | 5.4% | 18.7% |
Similar Demographics by Single Mother Poverty
Demographics Similar to Nonimmigrants by Single Mother Poverty
In terms of single mother poverty, the demographic groups most similar to Nonimmigrants are Cree (32.2%, a difference of 0.030%), Immigrants from the Azores (32.2%, a difference of 0.14%), Marshallese (32.1%, a difference of 0.22%), Spanish American (32.3%, a difference of 0.39%), and Immigrants from Zaire (32.0%, a difference of 0.62%).
| Demographics | Rating | Rank | Single Mother Poverty |
| Fijians | 0.1 /100 | #273 | Tragic 31.6% |
| Bangladeshis | 0.1 /100 | #274 | Tragic 31.7% |
| Central Americans | 0.1 /100 | #275 | Tragic 31.8% |
| Delaware | 0.0 /100 | #276 | Tragic 31.8% |
| Mexican American Indians | 0.0 /100 | #277 | Tragic 31.9% |
| Immigrants | Zaire | 0.0 /100 | #278 | Tragic 32.0% |
| Marshallese | 0.0 /100 | #279 | Tragic 32.1% |
| Immigrants | Nonimmigrants | 0.0 /100 | #280 | Tragic 32.2% |
| Cree | 0.0 /100 | #281 | Tragic 32.2% |
| Immigrants | Azores | 0.0 /100 | #282 | Tragic 32.2% |
| Spanish Americans | 0.0 /100 | #283 | Tragic 32.3% |
| Indonesians | 0.0 /100 | #284 | Tragic 32.4% |
| Immigrants | Latin America | 0.0 /100 | #285 | Tragic 32.4% |
| Yup'ik | 0.0 /100 | #286 | Tragic 32.5% |
| Immigrants | Dominica | 0.0 /100 | #287 | Tragic 32.5% |
Demographics Similar to Immigrants from Norway by Single Mother Poverty
In terms of single mother poverty, the demographic groups most similar to Immigrants from Norway are Immigrants from Uzbekistan (29.3%, a difference of 0.050%), Canadian (29.3%, a difference of 0.060%), South American Indian (29.3%, a difference of 0.090%), Immigrants from Eastern Africa (29.3%, a difference of 0.15%), and Nepalese (29.3%, a difference of 0.16%).
| Demographics | Rating | Rank | Single Mother Poverty |
| British | 50.6 /100 | #173 | Average 29.2% |
| Immigrants | Saudi Arabia | 50.0 /100 | #174 | Average 29.2% |
| Immigrants | Costa Rica | 48.8 /100 | #175 | Average 29.2% |
| Hawaiians | 47.8 /100 | #176 | Average 29.2% |
| Immigrants | Bosnia and Herzegovina | 45.1 /100 | #177 | Average 29.2% |
| South American Indians | 43.2 /100 | #178 | Average 29.3% |
| Immigrants | Uzbekistan | 42.6 /100 | #179 | Average 29.3% |
| Immigrants | Norway | 41.5 /100 | #180 | Average 29.3% |
| Canadians | 40.4 /100 | #181 | Average 29.3% |
| Immigrants | Eastern Africa | 38.5 /100 | #182 | Fair 29.3% |
| Nepalese | 38.3 /100 | #183 | Fair 29.3% |
| Nigerians | 38.0 /100 | #184 | Fair 29.3% |
| Ghanaians | 36.8 /100 | #185 | Fair 29.4% |
| Yugoslavians | 36.0 /100 | #186 | Fair 29.4% |
| Lebanese | 32.5 /100 | #187 | Fair 29.4% |