Barbadian vs Immigrants from Norway College, Under 1 year
COMPARE
Barbadian
Immigrants from Norway
College, Under 1 year
College, Under 1 year Comparison
Barbadians
Immigrants from Norway
61.1%
COLLEGE, UNDER 1 YEAR
0.2/ 100
METRIC RATING
262nd/ 347
METRIC RANK
70.2%
COLLEGE, UNDER 1 YEAR
99.9/ 100
METRIC RATING
45th/ 347
METRIC RANK
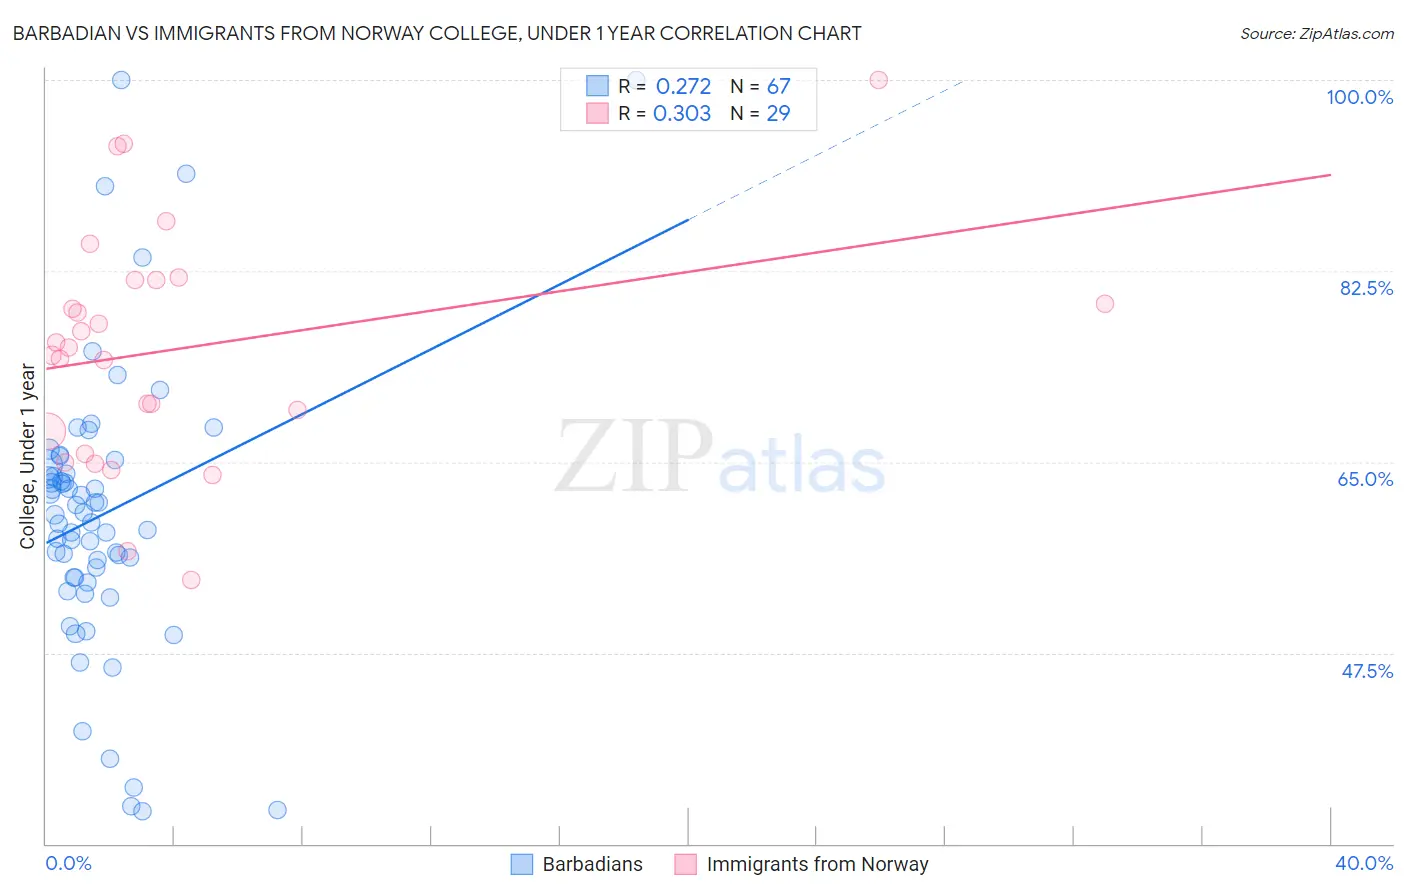
Barbadian vs Immigrants from Norway College, Under 1 year Correlation Chart
The statistical analysis conducted on geographies consisting of 141,304,590 people shows a weak positive correlation between the proportion of Barbadians and percentage of population with at least college, under 1 year education in the United States with a correlation coefficient (R) of 0.272 and weighted average of 61.1%. Similarly, the statistical analysis conducted on geographies consisting of 116,716,420 people shows a mild positive correlation between the proportion of Immigrants from Norway and percentage of population with at least college, under 1 year education in the United States with a correlation coefficient (R) of 0.303 and weighted average of 70.2%, a difference of 14.9%.
College, Under 1 year Correlation Summary
| Measurement | Barbadian | Immigrants from Norway |
| Minimum | 33.0% | 54.2% |
| Maximum | 100.0% | 100.0% |
| Range | 67.0% | 45.8% |
| Mean | 60.2% | 75.4% |
| Median | 60.2% | 75.5% |
| Interquartile 25% (IQ1) | 54.4% | 66.8% |
| Interquartile 75% (IQ3) | 64.7% | 81.7% |
| Interquartile Range (IQR) | 10.3% | 14.9% |
| Standard Deviation (Sample) | 13.2% | 10.7% |
| Standard Deviation (Population) | 13.1% | 10.5% |
Similar Demographics by College, Under 1 year
Demographics Similar to Barbadians by College, Under 1 year
In terms of college, under 1 year, the demographic groups most similar to Barbadians are Shoshone (61.1%, a difference of 0.010%), African (61.1%, a difference of 0.040%), Blackfeet (61.1%, a difference of 0.070%), Trinidadian and Tobagonian (61.1%, a difference of 0.070%), and Immigrants from Bahamas (61.1%, a difference of 0.070%).
| Demographics | Rating | Rank | College, Under 1 year |
| Comanche | 0.4 /100 | #255 | Tragic 61.4% |
| Bangladeshis | 0.4 /100 | #256 | Tragic 61.4% |
| Immigrants | Laos | 0.3 /100 | #257 | Tragic 61.3% |
| Immigrants | Bangladesh | 0.3 /100 | #258 | Tragic 61.3% |
| Indonesians | 0.3 /100 | #259 | Tragic 61.2% |
| Blackfeet | 0.3 /100 | #260 | Tragic 61.1% |
| Africans | 0.3 /100 | #261 | Tragic 61.1% |
| Barbadians | 0.2 /100 | #262 | Tragic 61.1% |
| Shoshone | 0.2 /100 | #263 | Tragic 61.1% |
| Trinidadians and Tobagonians | 0.2 /100 | #264 | Tragic 61.1% |
| Immigrants | Bahamas | 0.2 /100 | #265 | Tragic 61.1% |
| Alaskan Athabascans | 0.2 /100 | #266 | Tragic 61.0% |
| Americans | 0.2 /100 | #267 | Tragic 61.0% |
| Immigrants | Trinidad and Tobago | 0.1 /100 | #268 | Tragic 60.7% |
| Immigrants | West Indies | 0.1 /100 | #269 | Tragic 60.6% |
Demographics Similar to Immigrants from Norway by College, Under 1 year
In terms of college, under 1 year, the demographic groups most similar to Immigrants from Norway are Israeli (70.2%, a difference of 0.020%), New Zealander (70.2%, a difference of 0.020%), Immigrants from Lithuania (70.3%, a difference of 0.090%), Immigrants from Latvia (70.1%, a difference of 0.12%), and Immigrants from Kuwait (70.3%, a difference of 0.14%).
| Demographics | Rating | Rank | College, Under 1 year |
| Australians | 99.9 /100 | #38 | Exceptional 70.4% |
| Bhutanese | 99.9 /100 | #39 | Exceptional 70.3% |
| Immigrants | Turkey | 99.9 /100 | #40 | Exceptional 70.3% |
| Immigrants | Kuwait | 99.9 /100 | #41 | Exceptional 70.3% |
| Immigrants | Lithuania | 99.9 /100 | #42 | Exceptional 70.3% |
| Israelis | 99.9 /100 | #43 | Exceptional 70.2% |
| New Zealanders | 99.9 /100 | #44 | Exceptional 70.2% |
| Immigrants | Norway | 99.9 /100 | #45 | Exceptional 70.2% |
| Immigrants | Latvia | 99.9 /100 | #46 | Exceptional 70.1% |
| Immigrants | Bulgaria | 99.8 /100 | #47 | Exceptional 70.0% |
| Immigrants | Netherlands | 99.8 /100 | #48 | Exceptional 70.0% |
| Immigrants | Austria | 99.8 /100 | #49 | Exceptional 70.0% |
| Zimbabweans | 99.8 /100 | #50 | Exceptional 69.9% |
| Mongolians | 99.8 /100 | #51 | Exceptional 69.9% |
| Immigrants | Russia | 99.8 /100 | #52 | Exceptional 69.9% |